Published: 2026-06-19T01:50:18.000Z
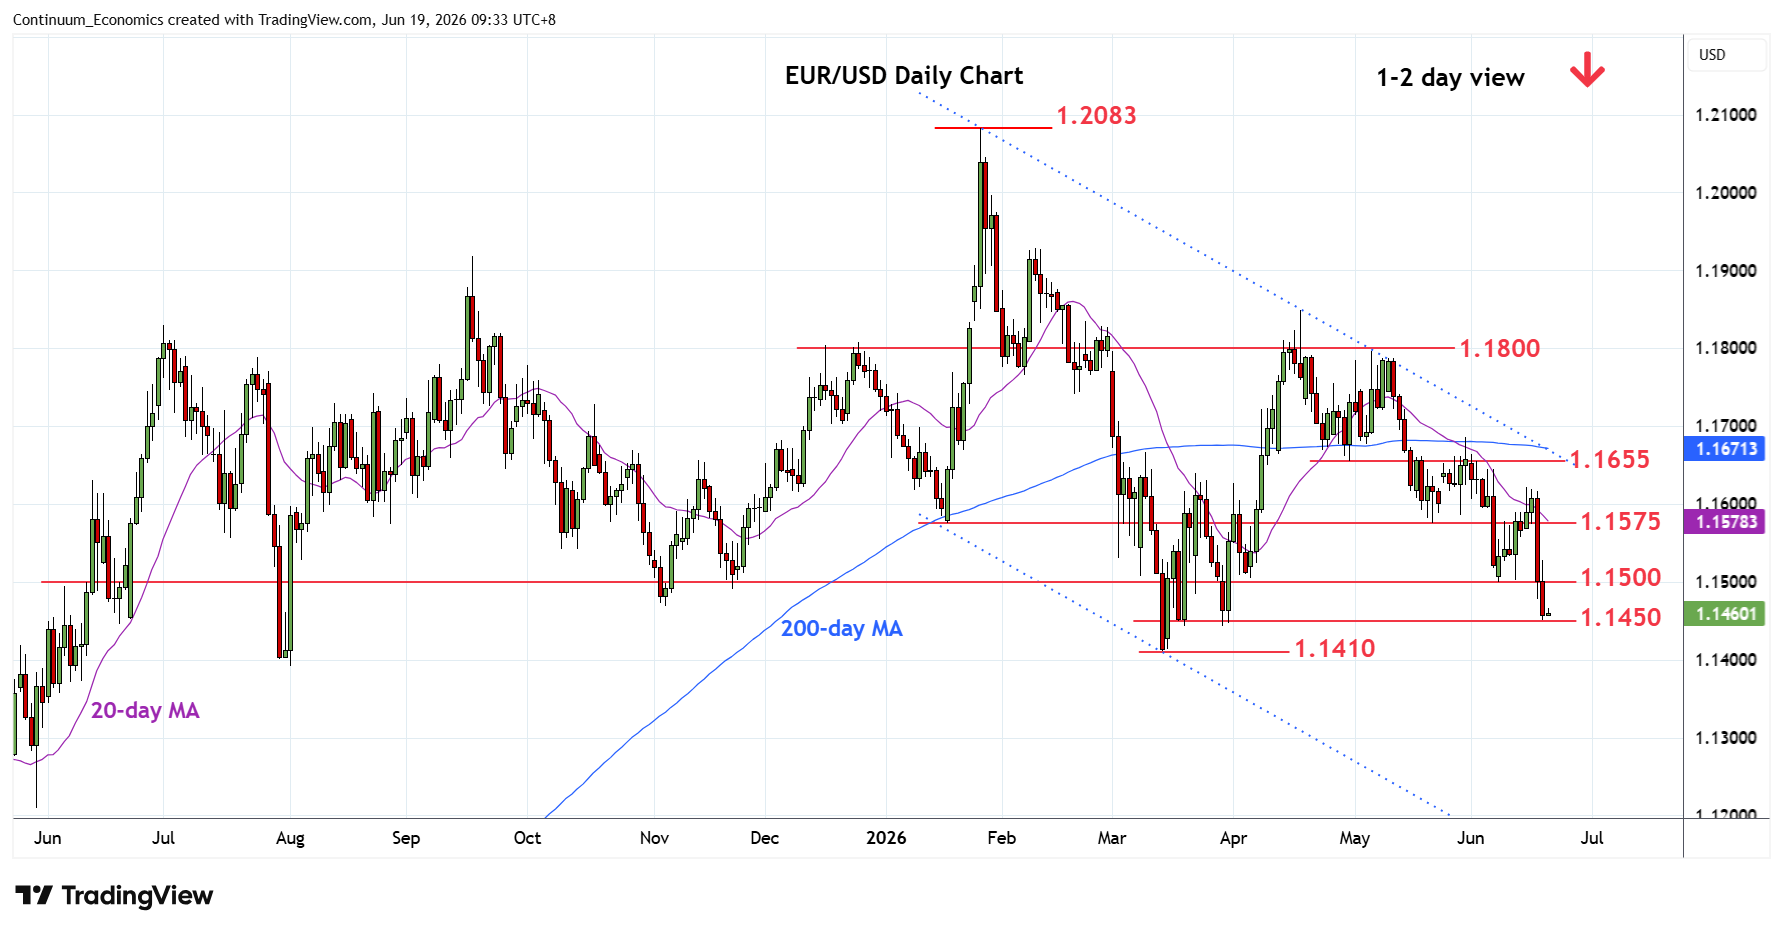
Chart EUR/USD Update: Consolidating at 1.1450 congestion
-
Break of the 1.1500 support further extend losses from the 1.1620 Monday's high to reach 1.1450 congestion
| Levels | Imp | Comment | Levels | Imp | Comment | |||
|---|---|---|---|---|---|---|---|---|
| R4 | 1.1600/20 | ** | congestion, 15 Jun high | S1 | 1.1450 | * | congestion | |
| R3 | 1.1575 | ** | May low | S2 | 1.1410 | ** | 13 Mar YTD low | |
| R2 | 1.1550 | congestion | S3 | 1.1400 | * | figure | ||
| R1 | 1.1500 | ** | 8 Jun low | S4 | 1.1355 | * | 38.2% Jan 2025/Jan rally |
Asterisk denotes strength of level
01:45 GMT - Break of the 1.1500 support further extend losses from the 1.1620 Monday's high to reach 1.1450 congestion. Consolidation here see prices unwinding oversold intraday studies but this is seen giving way to fresh selling interest later. Lower will see room to retest the 1.1410, 13 March current year low, and the 1.1400 figure. Lower still, will see room for deeper pullback to retrace gains from January 2025 year low to 1.1355, 38.2% Fibonacci level. Meanwhile, resistance is lowered to the 1.1500 figure and 8 June low which should cap immediate corrective bounce.