Published: 2026-11-18T15:01:59.000Z
Chart AUD/USD Update: Choppy in range - studies remain under pressure
1
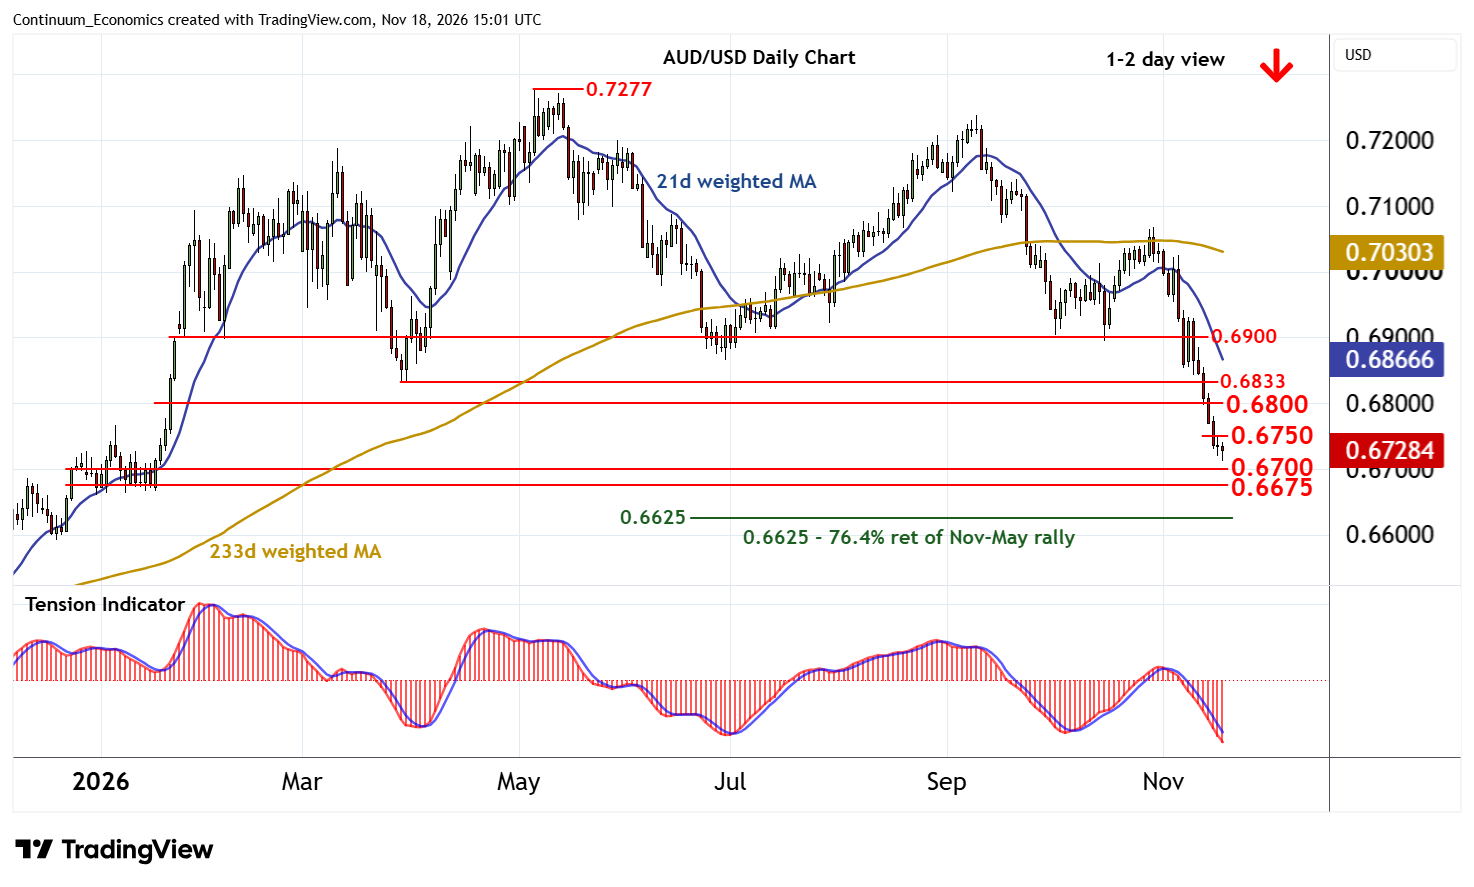
Consolidation has given way to a test down to 0.6710~
| Levels | Imp | Comment | Levels | Imp | Comment | |||
|---|---|---|---|---|---|---|---|---|
| R4 | 0.6865 | ** | 30 Jun (m) low | S1 | 0.6700 | ** | congestion | |
| R3 | 0.6833 | ** | 30-31 Mar (m) lows | S2 | 0.6675 | * | January congestion lows | |
| R2 | 0.6800 | break level | S3 | 0.6660 | ** | range lows | ||
| R1 | 0.6750 | break level | S4 | 0.6625 | ** | 76.4% ret of Nov-May rally |
Asterisk denotes strength of level
14:40 GMT - Consolidation has given way to a test down to 0.6710~, before settling back into consolidation around 0.6730. Intraday studies are rising and oversold daily stochastics are flattening, suggesting room for further cautious trade. But the bearish daily Tension Indicator and negative weekly charts point to room for further losses in the coming sessions towards congestion support at 0.6700. A break will extend losses from the 0.7277 current year high of 7 May initially towards the 0.6675 congestion lows from January.
Meanwhile, resistance is at the 0.6750 break level and extends to 0.6800. This range should cap any immediate tests higher.