Published: 2026-05-22T07:22:56.000Z
Chart AUD/JPY Update: Ranging within 114.00/113.00 area
1
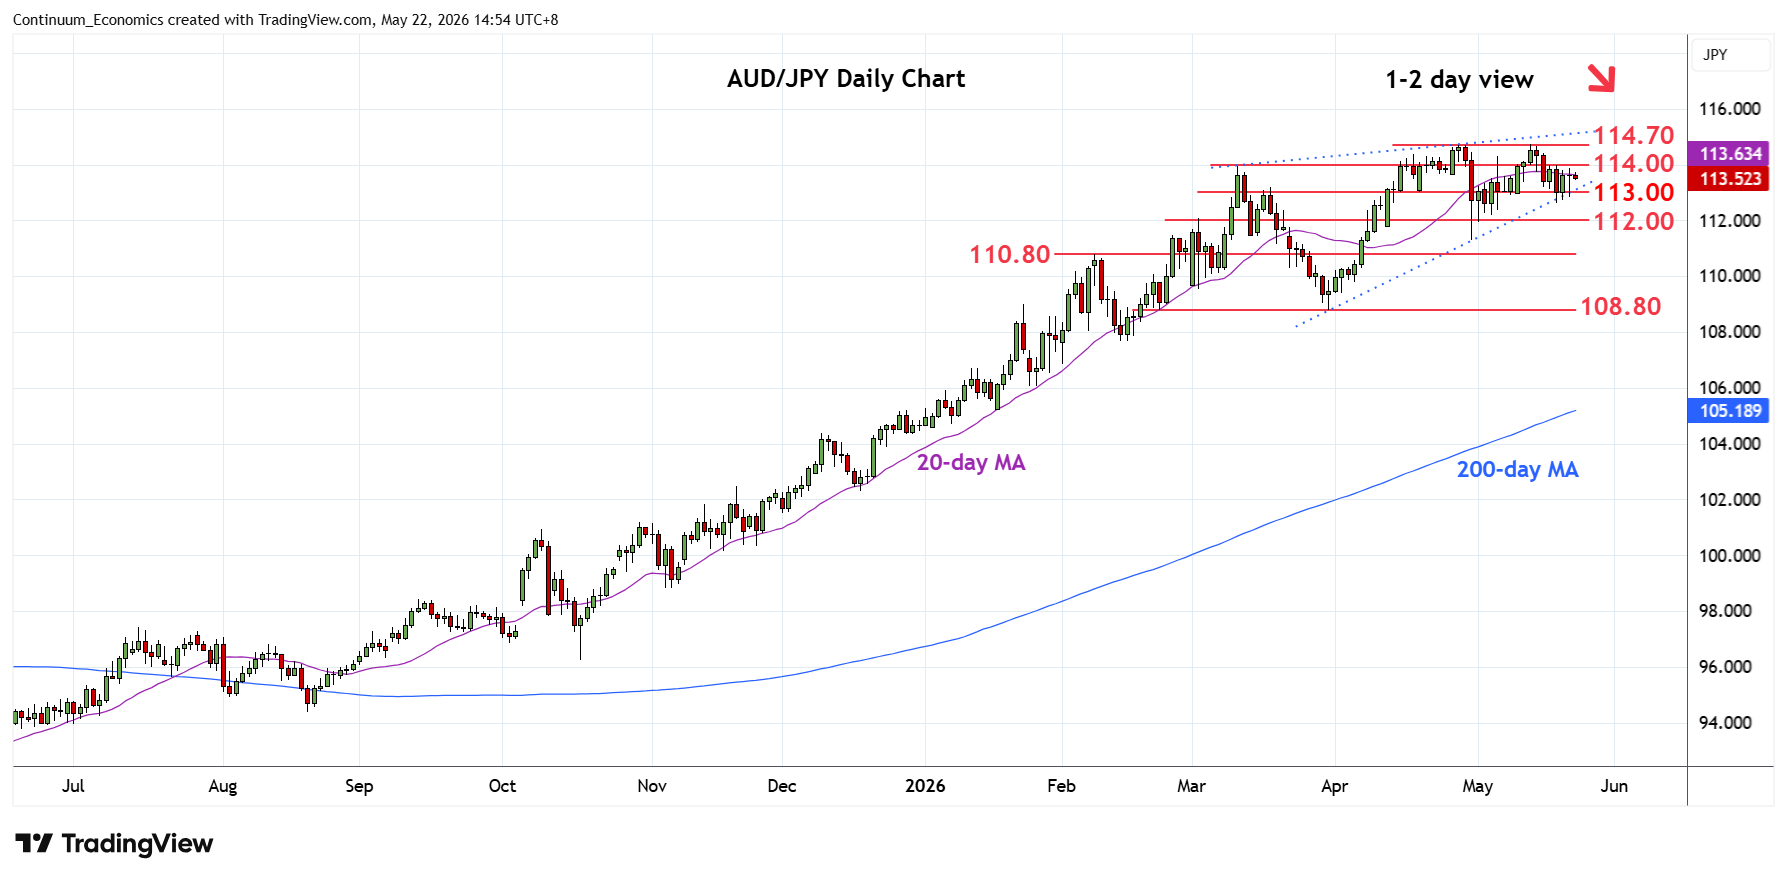
Little change, as prices extend consolidation within the 114.00/113.00 range
| Levels | Imp | Comment | Levels | Imp | Comment | |||
|---|---|---|---|---|---|---|---|---|
| R4 | 116.00 | * | congestion | S1 | 113.00 | * | congestion | |
| R3 | 115.00 | * | congestion | S2 | 112.00 | * | congestion | |
| R2 | 114.70 | ** | 28 Apr YTD high | S3 | 111.30 | ** | 30 Apr low | |
| R1 | 114.00 | * | Mar high, congestion | S4 | 110.80 | * | 9 Feb high |
Asterisk denotes strength of level
07.00 GMT - Little change, as prices extend consolidation within the 114.00/113.00 range following rejection from the 114.70 April/May highs. Would take break of support at the 113.00 congestion to open up room for deeper pullback to the 112.00 congestion and the 111.30, 30 April low. Below the latter will confirm a double top at the 114.70 highs and open up room for deeper pullback to support at 110.80/110.00 congestion and 108.80, March low. Meanwhile, resistance at 114.00/114.70 March and April highs are expected to cap.