Published: 2026-07-03T08:26:21.000Z
Chart USD Index DXY Update: Under pressure
2
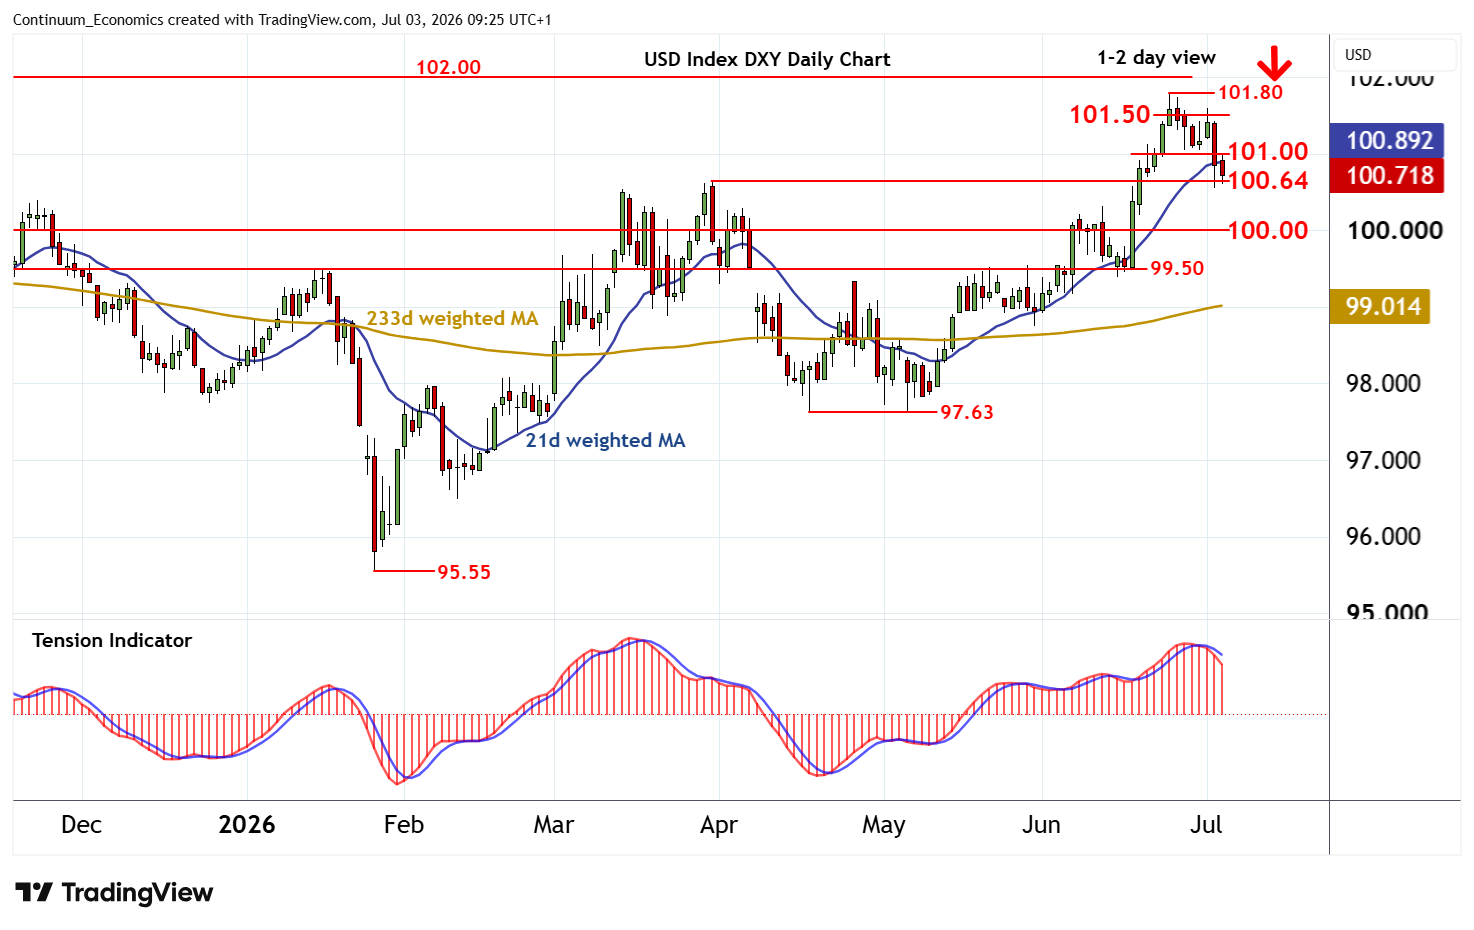
Cautious trade has given way to steady selling interest
| Levels | Imp | Comment | Levels | Imp | Comment | |||
|---|---|---|---|---|---|---|---|---|
| R4 | 102.00 | ** | congestion | S1 | 100.64 | ** | 31 Mar (m) high | |
| R3 | 101.80 | * | 24 Jun YTD high | S2 | 100.00 | ** | congestion | |
| R2 | 101.50 | intraday break level | S3 | 99.50 | * | congestion | ||
| R1 | 101.00 | ** | congestion base | S4 | 99.00 | ** | congestion |
Asterisk denotes strength of level
08:55 BST - Cautious trade has given way to steady selling interest, with prices reaching support at the 100.64 monthly high of 31 March before settling into consolidation above here. Daily stochastics and the daily Tension Indicator are falling, highlighting room for a break beneath here. June losses will then focus on congestion support at 100.00. But rising weekly charts should limit any initial tests in renewed consolidation above here. Meanwhile, resistance is lowered to the 101.00 congestion base. A close above here, if seen, will help to stabilise price action and prompt consolidation beneath 101.50.