Published: 2026-08-17T00:53:24.000Z
Chart USD/JPY Update: Leaning lower from 159.56 high
2
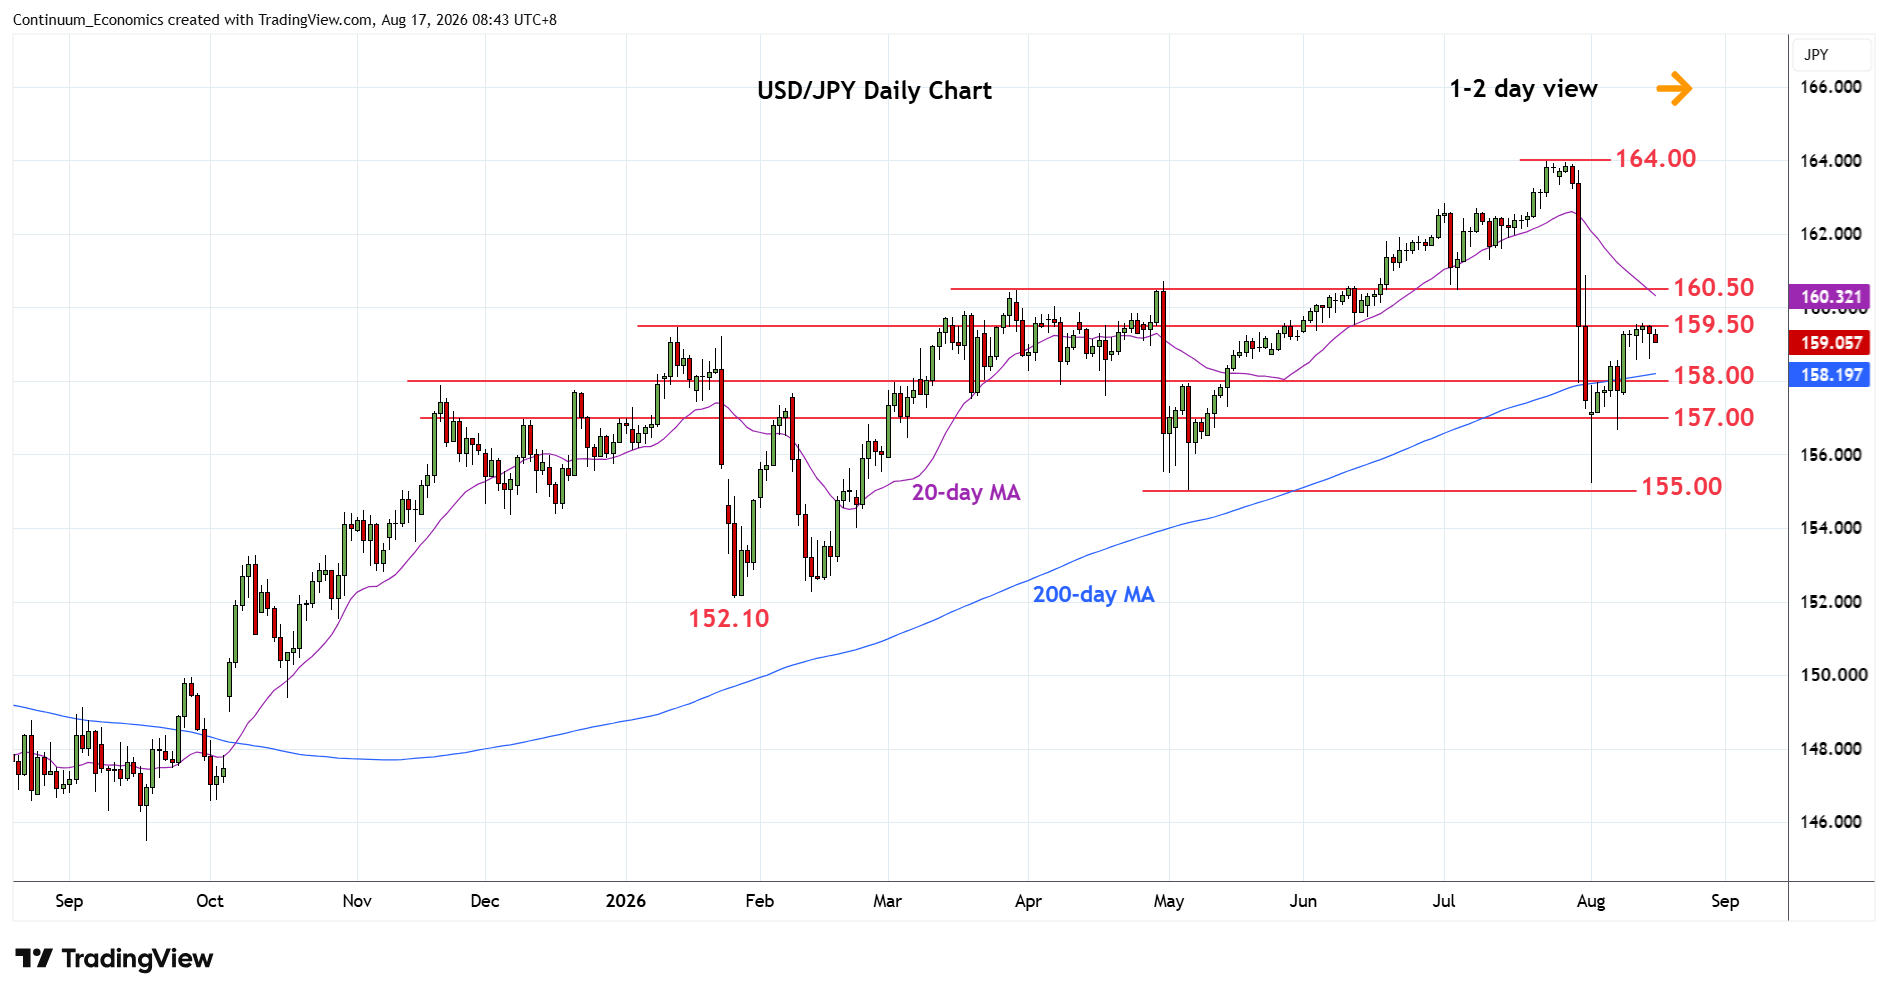
Consolidation at the 159.45/50 congestion area see prices rotating lower to unwind overbought intraday studies
| Levels | Imp | Comment | Levels | Imp | Comment | |||
|---|---|---|---|---|---|---|---|---|
| R4 | 161.00 | * | congestion | S1 | 158.50 | * | congestion | |
| R3 | 160.50 | ** | congestion, Mar high | S2 | 158.00 | * | congestion | |
| R2 | 160.00 | * | figure, congestion | S3 | 157.00 | * | congestion | |
| R1 | 159.50/56 | ** | congestion, 13 Aug high | S4 | 156.65 | * | 7 Aug low |
Asterisk denotes strength of level
00:45 GMT - Consolidation at the 159.45/50 congestion area see prices rotating lower to unwind overbought intraday studies. Daily studies are stretched as well and suggest scope for pullback to support at the 158.50/158.00 congestion area. Would take break here to return focus to the downside for retest of support at the 157.00/156.65 area and lower. Meanwhile, resistance at the 159.50/56 congestion and high of last week now expected to cap. Break, if seen, will open up room for extension to the 160.00 figure then 160.50 congestion and March high.