Published: 2026-07-22T01:44:07.000Z
Chart EUR/USD Update: Under pressure
1
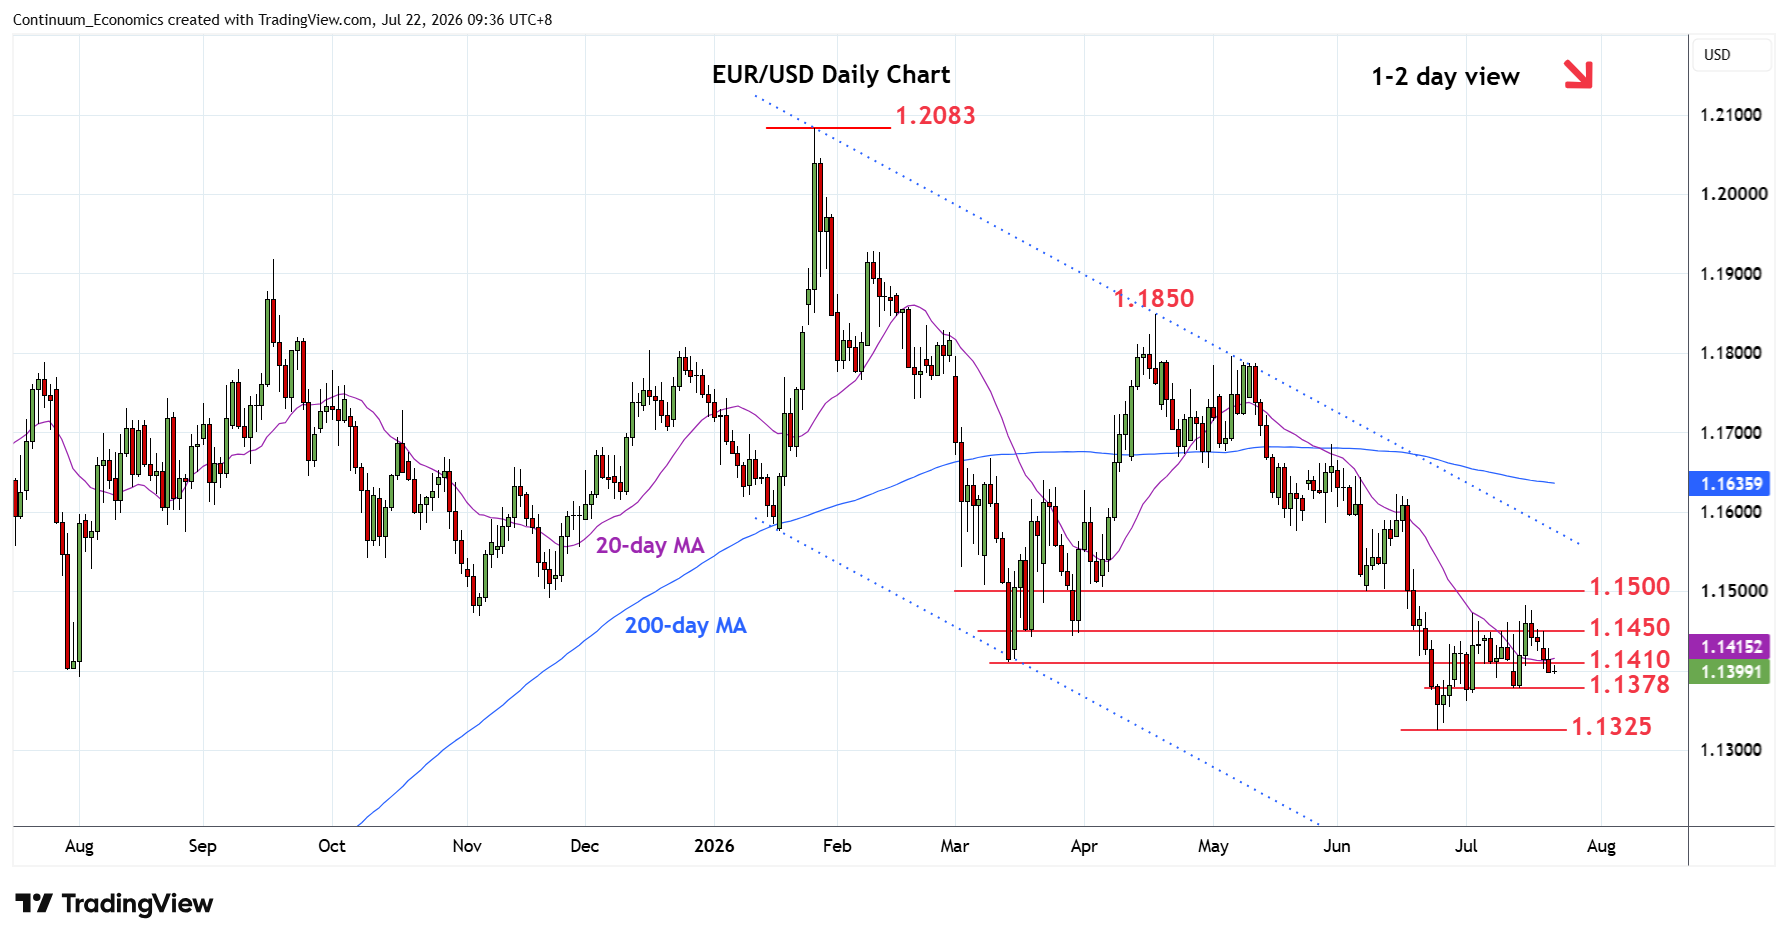
Under pressure, as prices extend pullback from the 1.1482 high of last week to weigh on support at the 1.1410/00 area
| Levels | Imp | Comment | Levels | Imp | Comment | |||
|---|---|---|---|---|---|---|---|---|
| R4 | 1.1550/75 | ** | congestion, May low | S1 | 1.1378 | * | 13 Jul low | |
| R3 | 1.1500 | ** | 8 Jun low | S2 | 1.1325 | ** | 24 Jun YTD low | |
| R2 | 1.1482 | * | 15 Jul high | S3 | 1.1300 | * | congestion | |
| R1 | 1.1450 | * | congestion | S4 | 1.1275 | * | 2023 year high |
Asterisk denotes strength of level
01:40 GMT - Under pressure, as prices extend pullback from the 1.1482 high of last week to weigh on support at the 1.1410/00 area. Negative daily studies keep pressure on the downside and see risk for break here to see extension to 1.1378 support. Below here will open up the 1.1325 June current year low to retest and threaten extension of losses from the January high. Meanwhile, resistance remains at the 1.1450 congestion and extending to 1.1482 high. Would take break here to turn focus higher to retrace losses from the 1.1850 April swing high.