Published: 2026-08-19T08:00:04.000Z
Chart USD Index DXY Update: Cautious trade - prices coming under pressure
3
Cautious trade is giving way to a drift lower
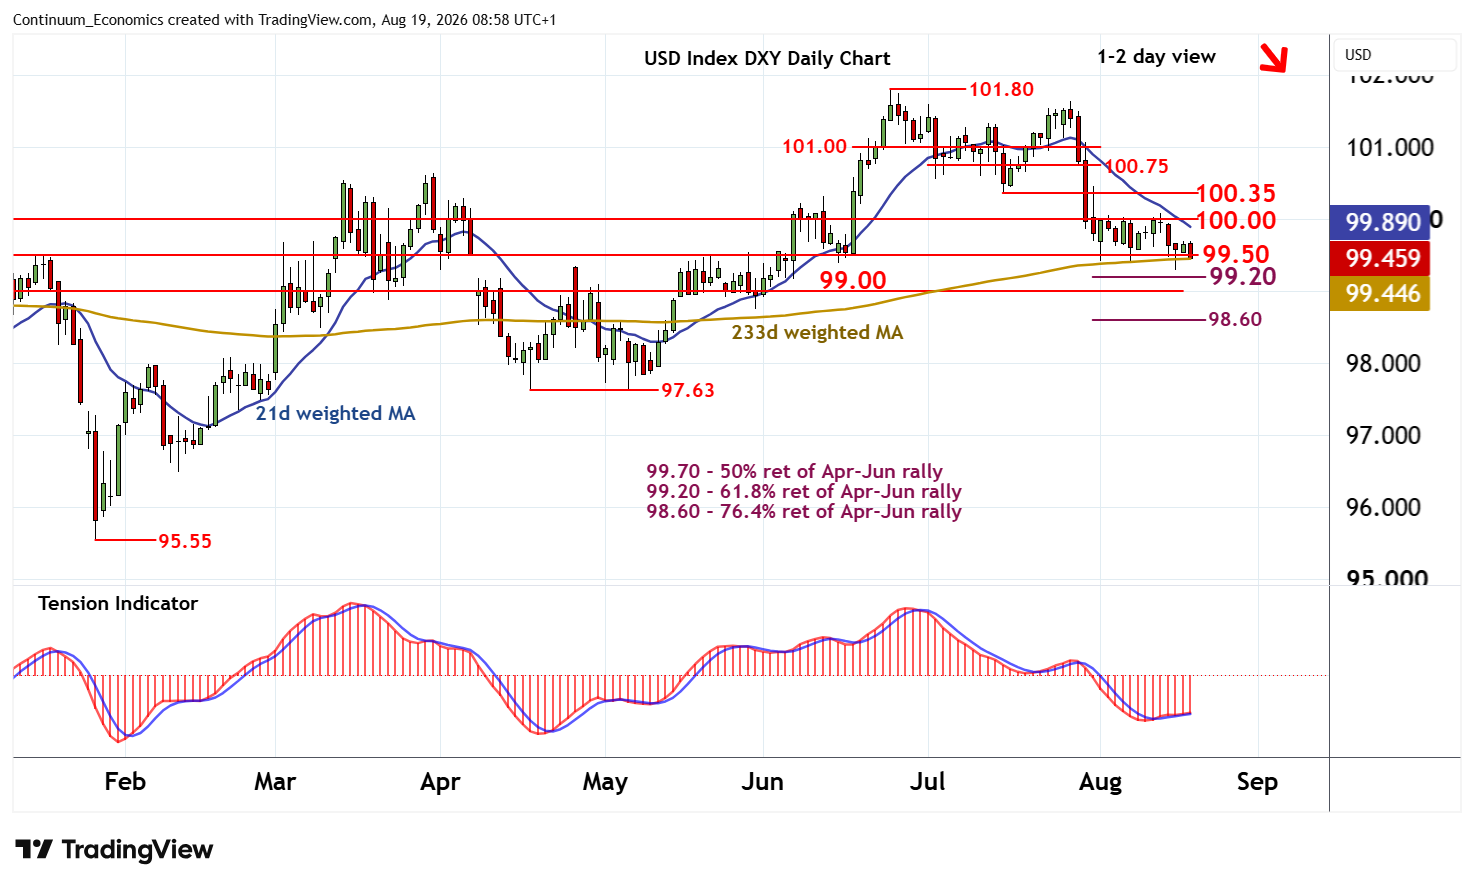
| Levels | Imp | Comment | Levels | Imp | Comment | |||
|---|---|---|---|---|---|---|---|---|
| R4 | 101.00 | * | congestion | S1 | 99.50 | ** | congestion base | |
| R3 | 100.75 | congestion | S2 | 99.20 | ** | 61.8% ret of Apr-Jun rally | ||
| R2 | 100.35 | ** | 15 Jul (w) low | S3 | 99.00 | ** | congestion | |
| R1 | 100.00 | ** | congestion | S4 | 98.60 | ** | 76.4% ret of Apr-Jun rally |
Asterisk denotes strength of level
08:55 BST - Cautious trade is giving way to a drift lower, as intraday studies turn down, with prices currently testing levels just below support at 99.50. A break will open up the 99.20 Fibonacci retracement. But mixed daily readings should limit any initial tests in consolidation, before bearish weekly charts prompt further losses. A close beneath here will add weight to sentiment and extend late-June losses towards congestion around 99.00, ahead of the 98.60 resistance.
Meanwhile, resistance remains up to congestion around 100.00. An unexpected break should meet fresh selling interest beneath the 100.35 weekly low of 15 July.