Chart EUR/SEK Update: Consolidating gains as studies turn mixed
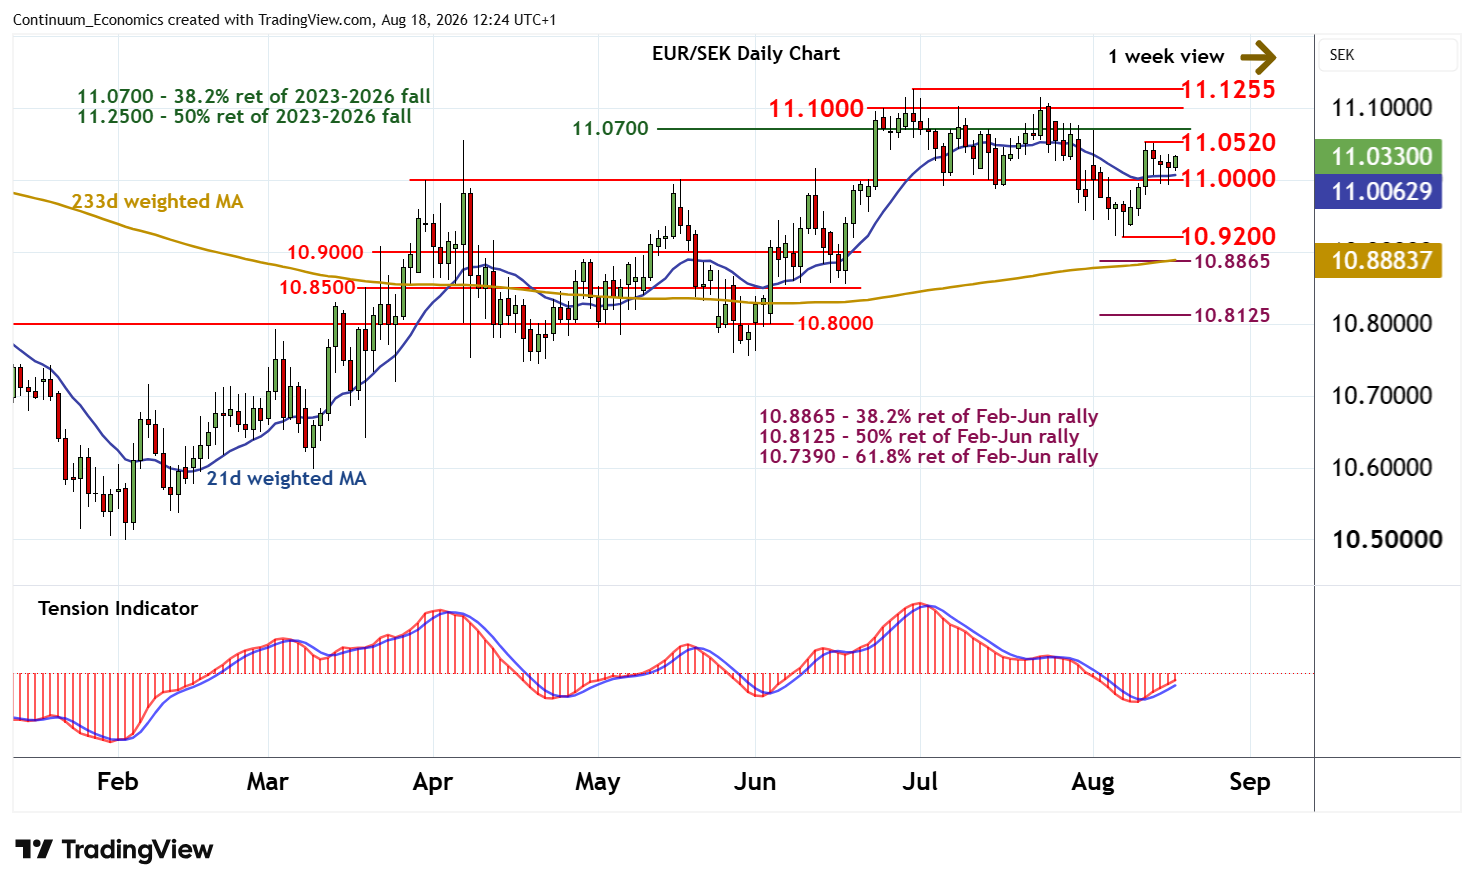
Anticipated gains have extended beyond 11.0000 to reach 11.0520, where flat overbought daily stochastics are prompting a pullback and consolidation
| Levels | Imp | Comment | Levels | Imp | Comment | |||
| R4 | 11.1500 | * | congestion | S1 | 11.0000 | ** | break level | |
| R3 | 11.1255 | ** | 30 Jun YTD high | S2 | 10.9200 | ** | 7 Aug (w) low | |
| R2 | 11.1000 | ** | range highs | S3 | 10.9000 | * | congestion | |
| R1 | 11.0520 | * | 12 Aug (w) high | S4 | 10.8865 | * | 38.2% ret of Feb-Jun rally |
Asterisk denotes strength of level
11:40 BST - Anticipated gains have extended beyond 11.0000 to reach 11.0520, where flat overbought daily stochastics are prompting a pullback and consolidation within the 11.0000 - 11.0520 range. The rising daily Tension Indicator highlights room for a retest of the 11.0520 weekly high of 12 August. But mixed weekly charts should limit any initial break in renewed consolidation beneath critical multi-month resistance within 11.1000 - 11.1255. Long-term charts are rising. But a close above here is needed to turn sentiment positive and confirm continuation of February gains.
Meanwhile, support is at 11.0000. A close beneath here, if seen, will add weight to sentiment and open up strong support at the 10.9200 weekly low of 7 August. However, mixed weekly charts should prompt consolidation above here. An unexpected break will turn sentiment negative and extend losses from the 11.1255 current year high of 30 June initially towards the 10.8865 Fibonacci retracement.