Published: 2026-09-02T00:41:35.000Z
Chart NZD/USD Update: Under pressure, room for lower
1
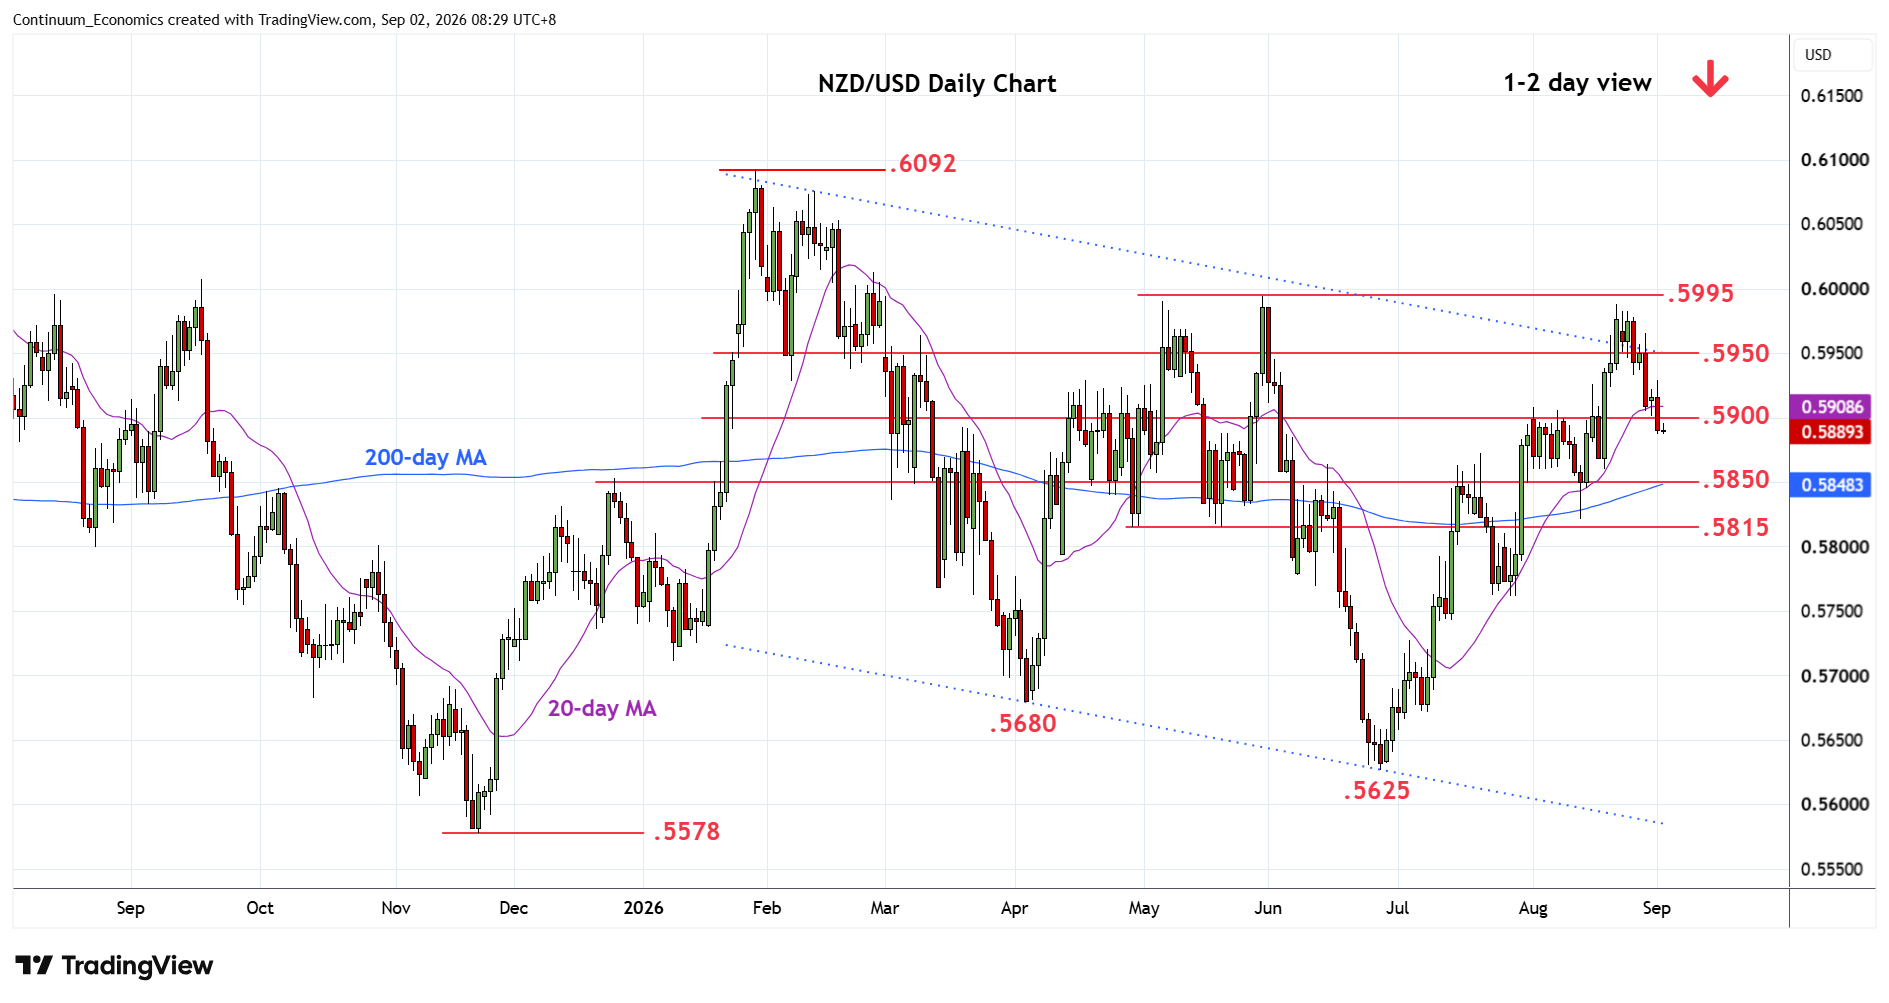
Consolidation above .5900 has given way to break to extend losses from the .5988 high of 21 August
| Levels | Imp | Comment | Levels | Imp | Comment | |||
|---|---|---|---|---|---|---|---|---|
| R4 | .5995 | ** | May high | S1 | .5850 | * | congestion, 38.2% | |
| R3 | .5988 | ** | 21 Aug high | S2 | .5815 | ** | May low | |
| R2 | .5950 | * | congestion | S3 | .5805/00 | * | 50%, congestion | |
| R1 | .5930 | 1 Sep high | S4 | .5762/50 | ** | 23 Jul low, congestion |
Asterisk denotes strength of level
00:35 GMT - Consolidation above .5900 has given way to break to extend losses from the .5988 high of 21 August. Negative daily and weekly studies keep pressure on the downside and lower will see room for further losses to retrace strong gains from the .5625 June current year low towards support at the .5850 congestion and 38.2% Fibonacci level. Meanwhile, resistance is lower to the .5930/.5950 area now expected to cap. Regaining this area will ease the downside pressire and expose the .5988 high to retest and see room for extension to the May high at .5995 and the .6000 figure.