Published: 2026-06-23T00:18:37.000Z
Chart AUD/USD Update: Under pressure
1
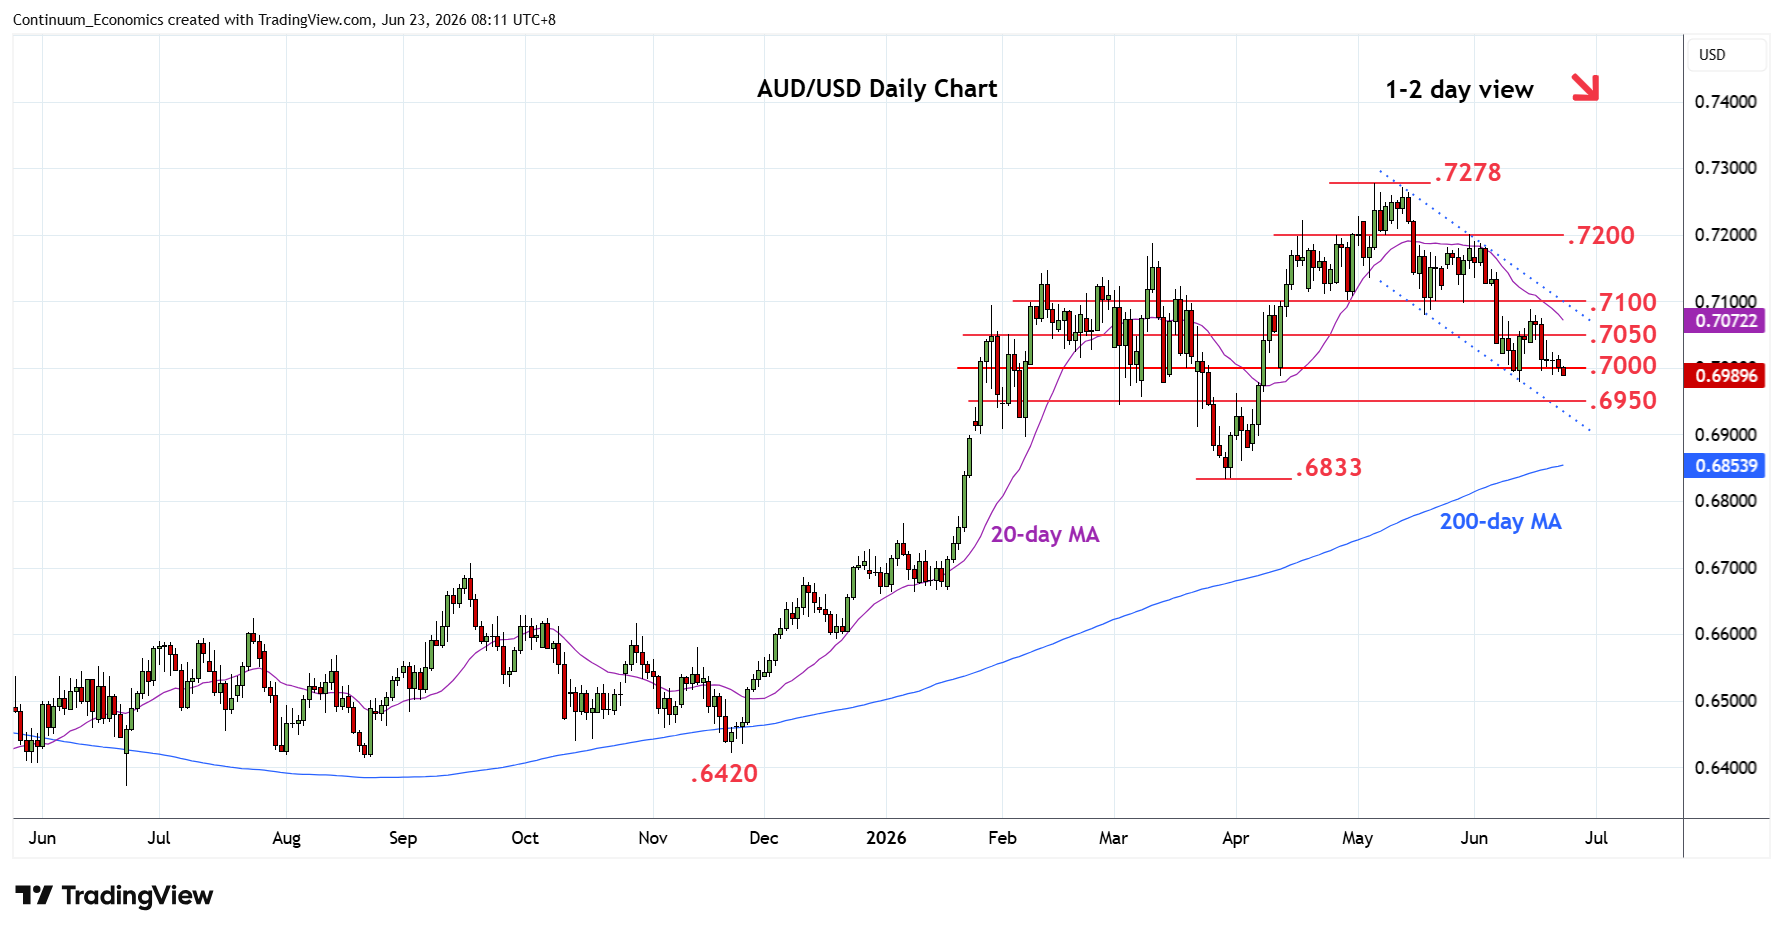
Edging lower through the .7000 level to expose the .6980 low to retest
| Levels | Imp | Comment | Levels | Imp | Comment | |||
|---|---|---|---|---|---|---|---|---|
| R4 | 0.7200 | ** | 29 May high, congestion | S1 | 0.7000 | * | congestion | |
| R3 | 0.7150 | * | congestion | S2 | 0.6980 | ** | 11 Jun low | |
| R2 | 0.7080/00 | ** | May low, congestion | S3 | 0.6950 | * | congestion | |
| R1 | 0.7050 | * | congestion | S4 | 0.6900 | * | congestion |
Asterisk denotes strength of level
00:15 GMT - Edging lower through the .7000 level to expose the .6980 low to retest. Break here will extend losses from the .7278 May current year high and see room to .6950 congestion then the .6900 level. Below these, if seen, will turn focus to the .6833 May low. However, bullish structure from the April 2025 low suggest the latter keeping losses in check and giving way to renewed buying interest later with resistance starting at .7050 congestion then the .7080/.7100 area. Above the latter needed to revive upside focus.