Chart USD/CAD Update: Consolidating test of critical resistance
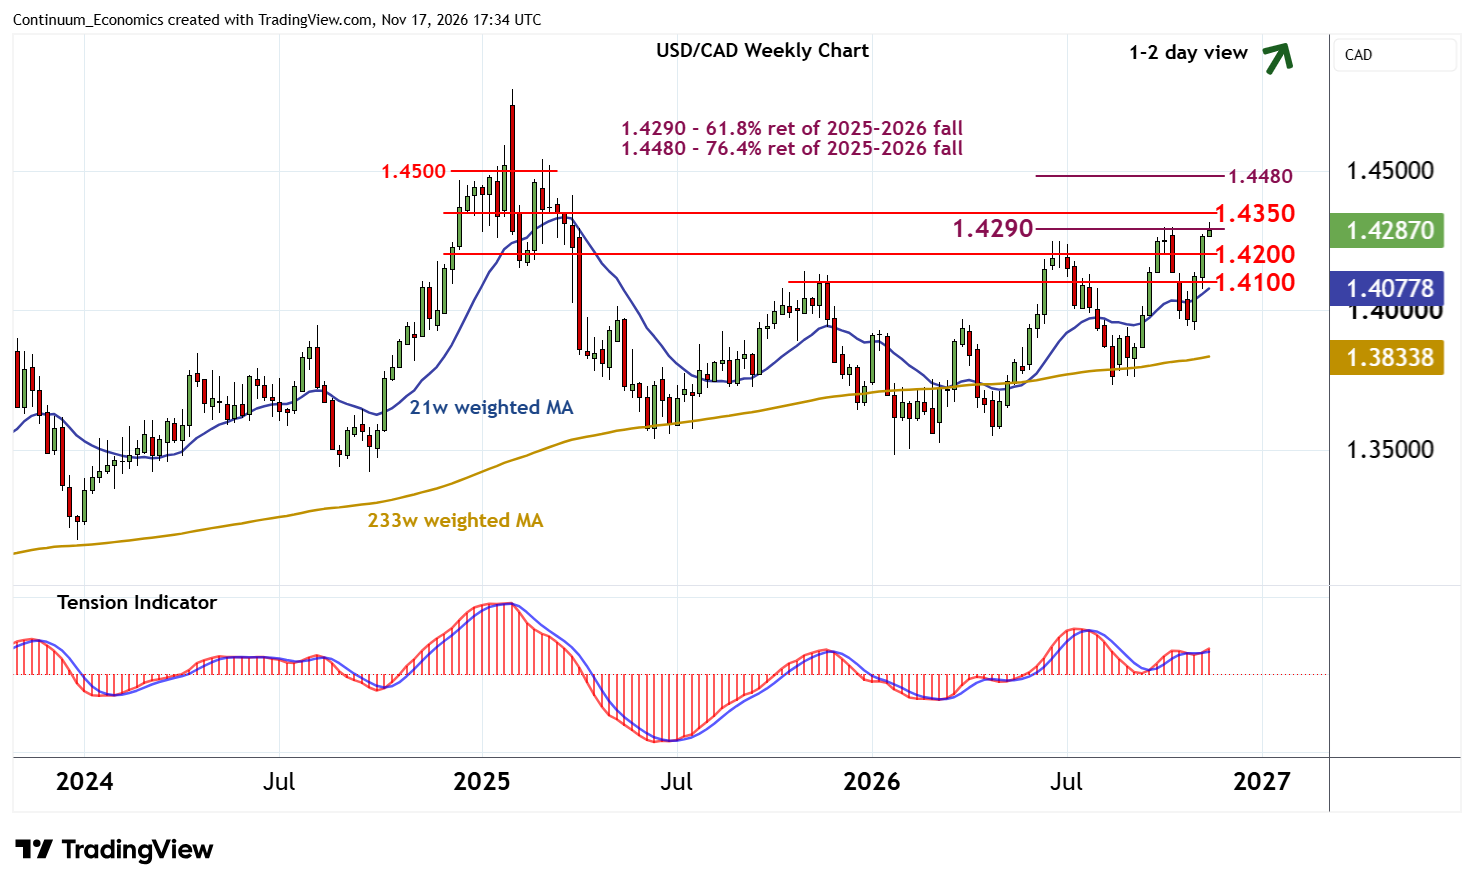
Anticipated gains have reached critical resistance at the 1.4290 Fibonacci retracement and the 1.4300 monthly high of 14 October
| Levels | Imp | Comment | Levels | Imp | Comment | |||
|---|---|---|---|---|---|---|---|---|
| R4 | 1.4480 | ** | 76.4% ret of 2025-2026 fall | S1 | 1.4200 | ** | congestion | |
| R3 | 1.4400 | ** | congestion | S2 | 1.4135 | intraday highs | ||
| R2 | 1.4350 | * | congestion | S3 | 1.4100 | minor congestion | ||
| R1 | 1.4290/00 | ** | 61.8% ret; 9-14 Oct (m) high | S4 | 1.4050 | break level |
Asterisk denotes strength of level
17:15 GMT - Anticipated gains have reached critical resistance at the 1.4290 Fibonacci retracement and the 1.4300 monthly high of 14 October, where negative intraday studies and flat overbought daily stochastics are prompting short-term reactions. In the coming sessions, a pullback is possible. But the rising daily Tension Indicator and improving weekly charts should limit scope in renewed buying interest above congestion support at 1.4200.
Following cautious/corrective trade, fresh gains are looked for. However, a close above 1.4290/00 is needed to improve sentiment and extend January gains initially towards historic congestion around 1.4350.