Chart EUR/NOK Update: Lower in range - studies coming under pressure
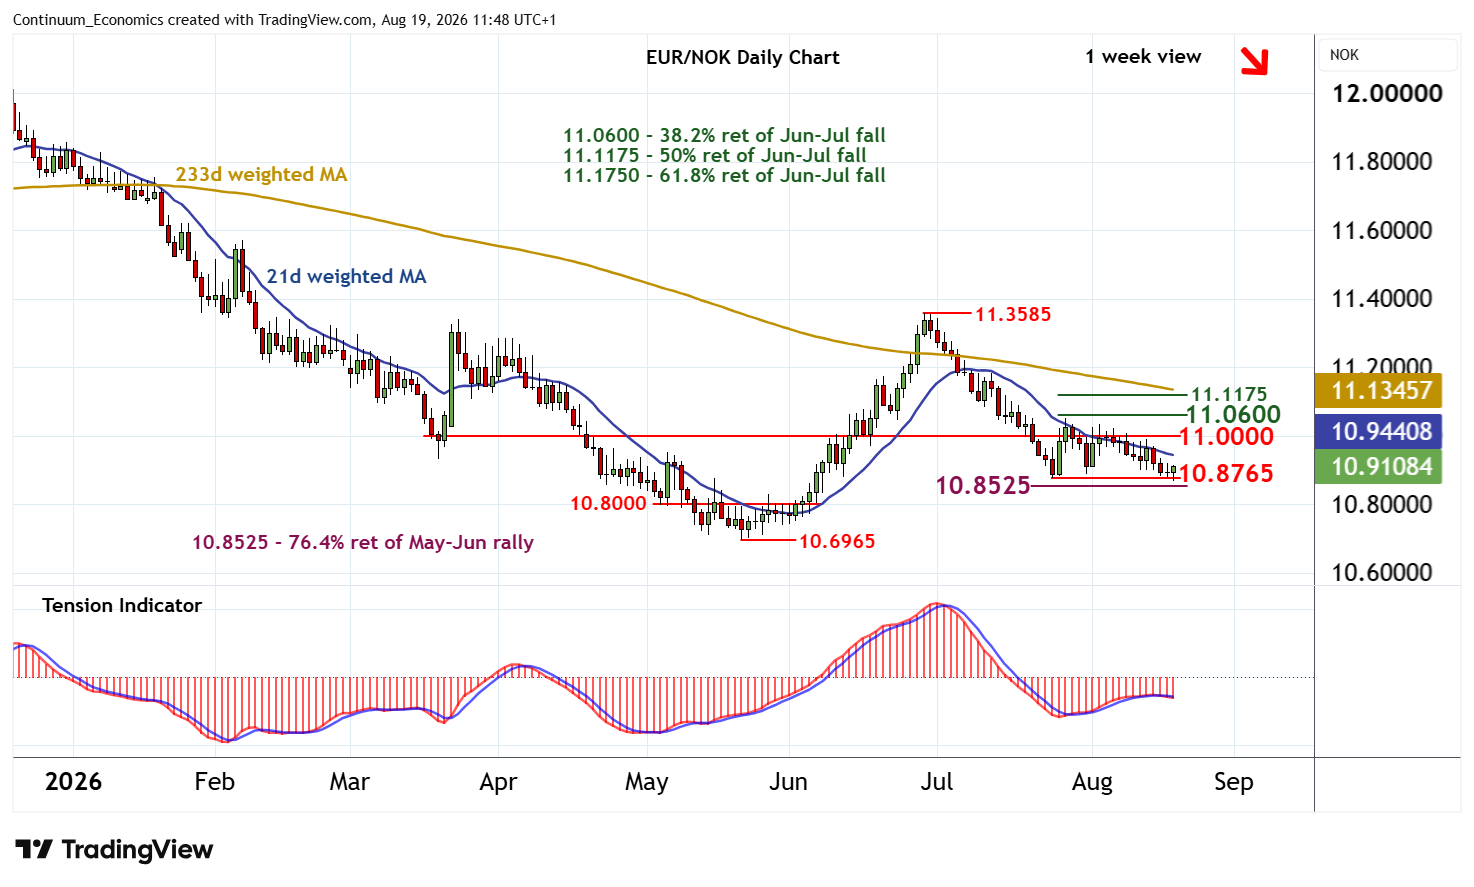
The anticipated drift lower has reached strong multi-week support within the 10.8525 Fibonacci retracement and the 10.8765 monthly low of 24 July
| Levels | Imp | Comment | Levels | Imp | Comment | |||
|---|---|---|---|---|---|---|---|---|
| R4 | 11.1750 | ** | 61.8% ret of Jun-Jul fall | S1 | 10.8765 | ** | 24 Jul (m) low | |
| R3 | 11.1175 | ** | 50% ret of Jun-Jul fall | S2 | 10.8525 | ** | 76.4% ret of May-Jun rally | |
| R2 | 11.0600 | ** | 38.2% ret of Jun-Jul fall | S3 | 10.8000 | * | break level | |
| R1 | 11.0000 | * | congestion | S4 | 10.6965 | ** | 21 May YTD low |
Asterisk denotes strength of level
11:40 BST - The anticipated drift lower has reached strong multi-week support within the 10.8525 Fibonacci retracement and the 10.8765 monthly low of 24 July, where flat oversold daily stochastics are prompting short-term consolidation. The daily Tension Indicator is coming under pressure and broader weekly charts are turning mixed/negative, suggesting room for further losses in the coming sessions. A close beneath here will turn sentiment negative and extend losses from the 11.3585 monthly high of 29 June initially towards congestion around 10.8000. Mixed longer-term charts, however, could limit any deeper losses in consolidation within congestion above critical support at the 10.6965 current year low of 21 May.
Meanwhile, resistance remains at 11.0000 and extends to the 11.0600 Fibonacci retracement. This range should cap any immediate tests higher. A close above here, not seen, would turn sentiment positive and extend late-July gains towards the 11.1175 retracement.