Published: 2026-09-16T01:49:19.000Z
Chart GBP/USD Update: Under pressure
1
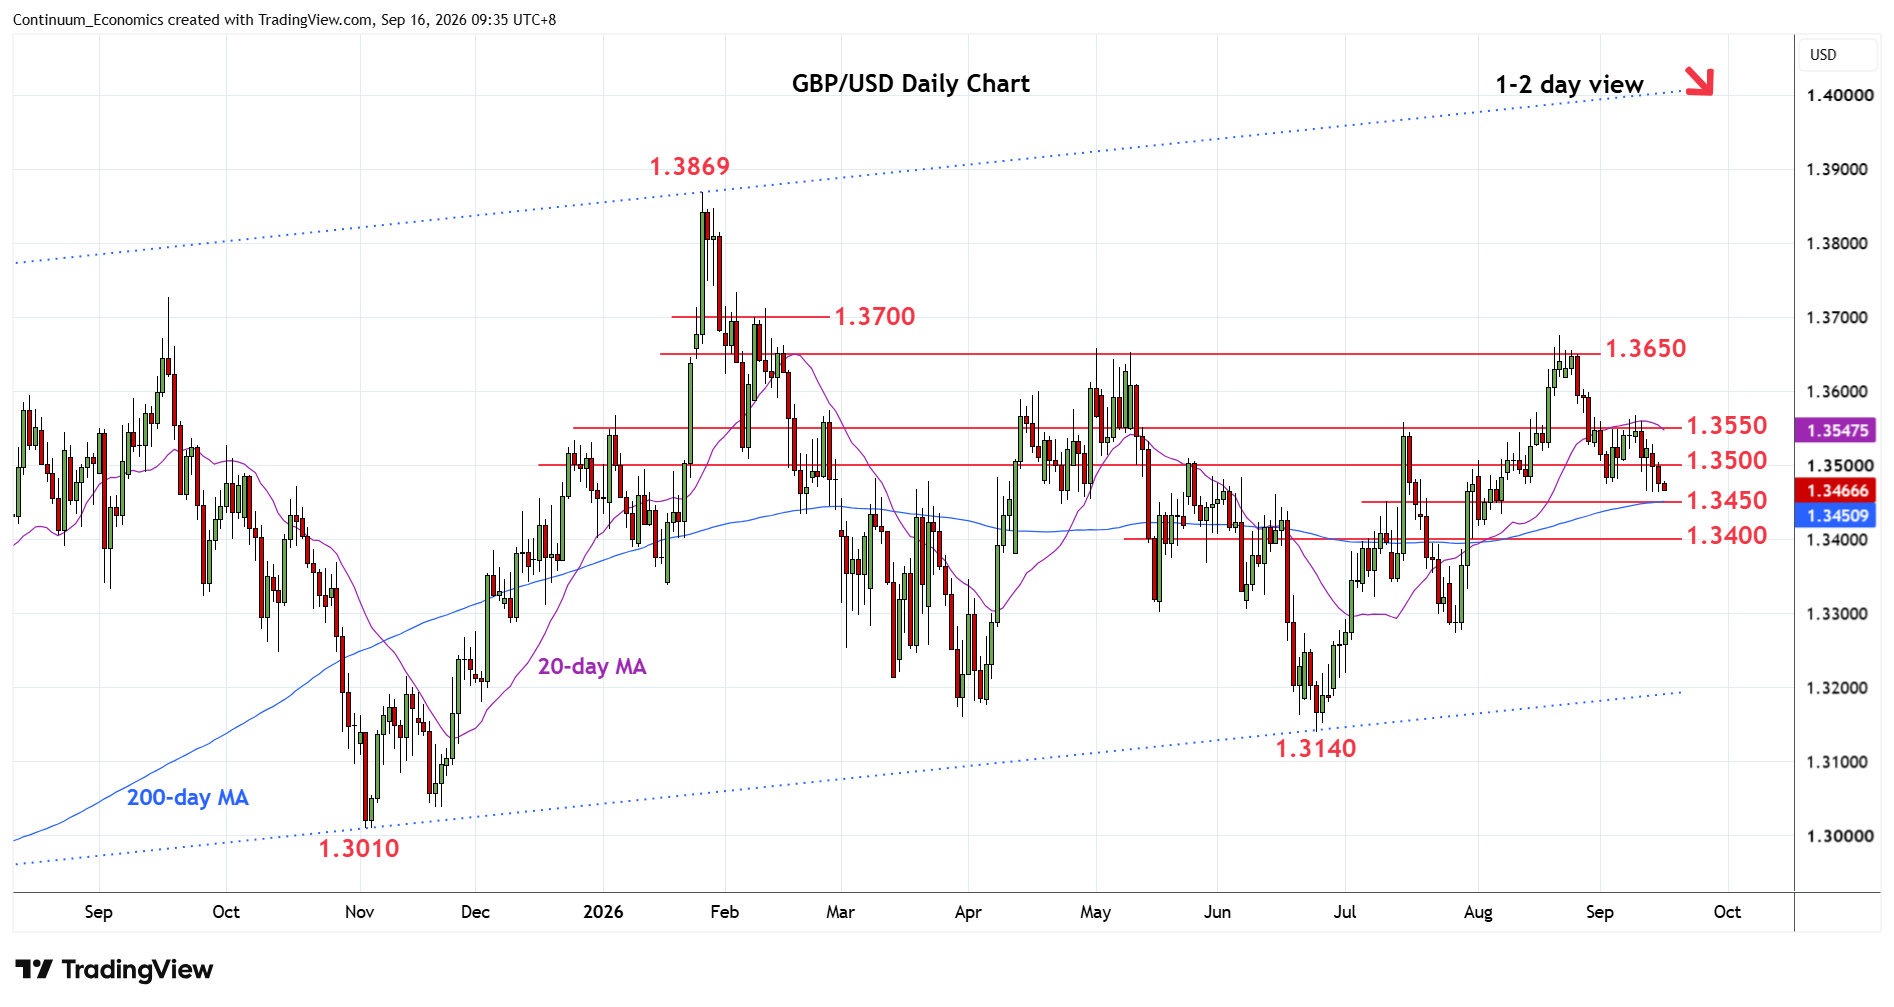
Edging lower to extend losses from the 1.3568 high of last week and nearby will see room to 1.3450 congestion
| Level | Comment | Level | Comment | |||||
|---|---|---|---|---|---|---|---|---|
| R4 | 1.3650/75 | ** | congestion, Aug high | S1 | 1.3450 | * | congestion | |
| R3 | 1.3600 | * | congestion | S2 | 1.3410 | * | 50% Jun/Aug rally | |
| R2 | 1.3550/68 | ** | congestion, 9 Sep high | S3 | 1.3345 | * | 61.8% Jun/Aug rally | |
| R1 | 1.3500 | * | congestion | S4 | 1.3300 | * | congestion |
Asterisk denotes strength of level
01:40 GMT - Edging lower to extend losses from the 1.3568 high of last week and nearby will see room to 1.3450 congestion. Negative daily and weekly studies weighs suggest scope for break here to see room for deeper pullback to retrace the June/August gains. Lower will see room to 1.3410 and 1.3345, Fibonacci levels. Meanwhile, resistance is lowered to the 1.3500 congestion which is expected to cap. Would need to regain this to ease the downside pressure and open up room for retest of strong resistance at 1.3550/68 congestion and high of last week.