Published: 2026-07-31T00:25:53.000Z
Chart AUD/USD Update: Extending gains
1
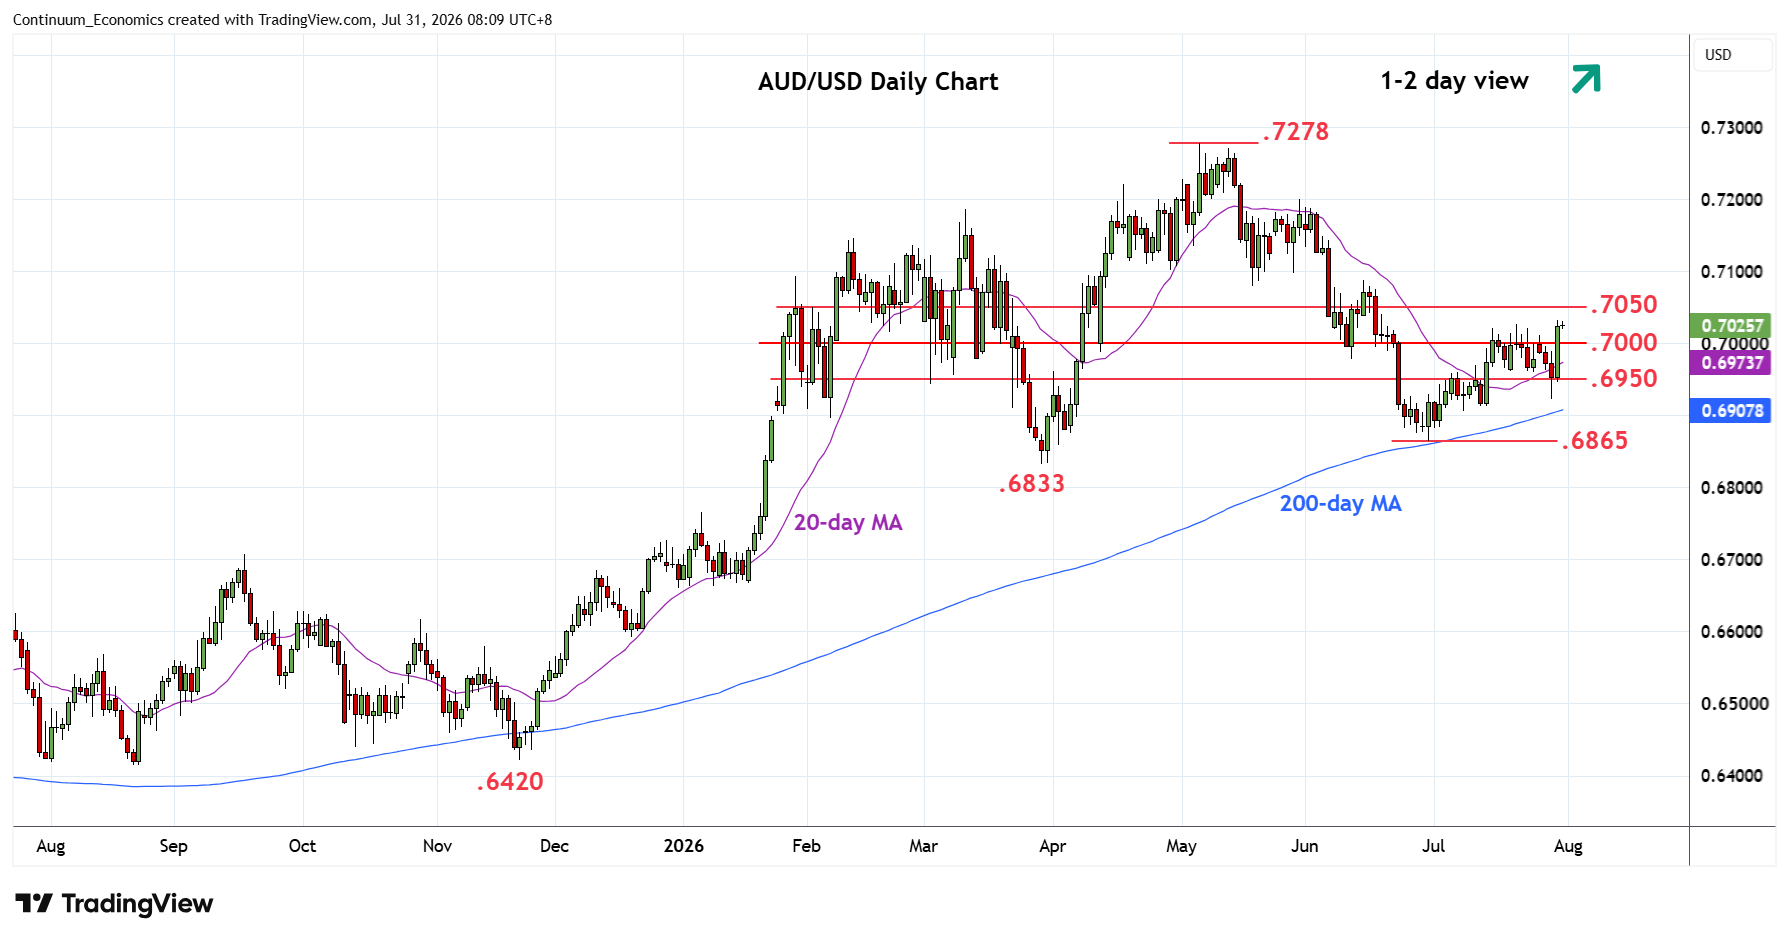
Sharply higher through the .7000 level as prices extend bounce from the .6922 spike low
| Levels | Imp | Comment | Levels | Imp | Comment | |||
|---|---|---|---|---|---|---|---|---|
| R4 | 0.7120 | * | 61.8% May/Jun fall | S1 | 0.7000 | * | figure, congestion | |
| R3 | 0.7100 | ** | congestion | S2 | 0.6950 | * | congestion | |
| R2 | 0.7080 | * | May low | S3 | 0.6922 | ** | 29 Jul low | |
| R1 | 0.7050 | * | congestion | S4 | 0.6900 | * | congestion |
Asterisk denotes strength of level
00:15 GMT - Sharply higher through the .7000 level as prices extend bounce from the .6922 spike low. Bullish break above .7000/27 congestion and high of last week turn focus to the .7050 resistance to further retrace the May/June losses. Higher still, will see room to 50% Fibonacci level at .7070 then the strong resistance at the .7080/.7100 congestion area. Meanwhile, support is raised to the .7000 level and this extend to the .6950 congestion which should underpin and sustain bounce from the .6922 low.