Published: 2026-07-17T00:19:26.000Z
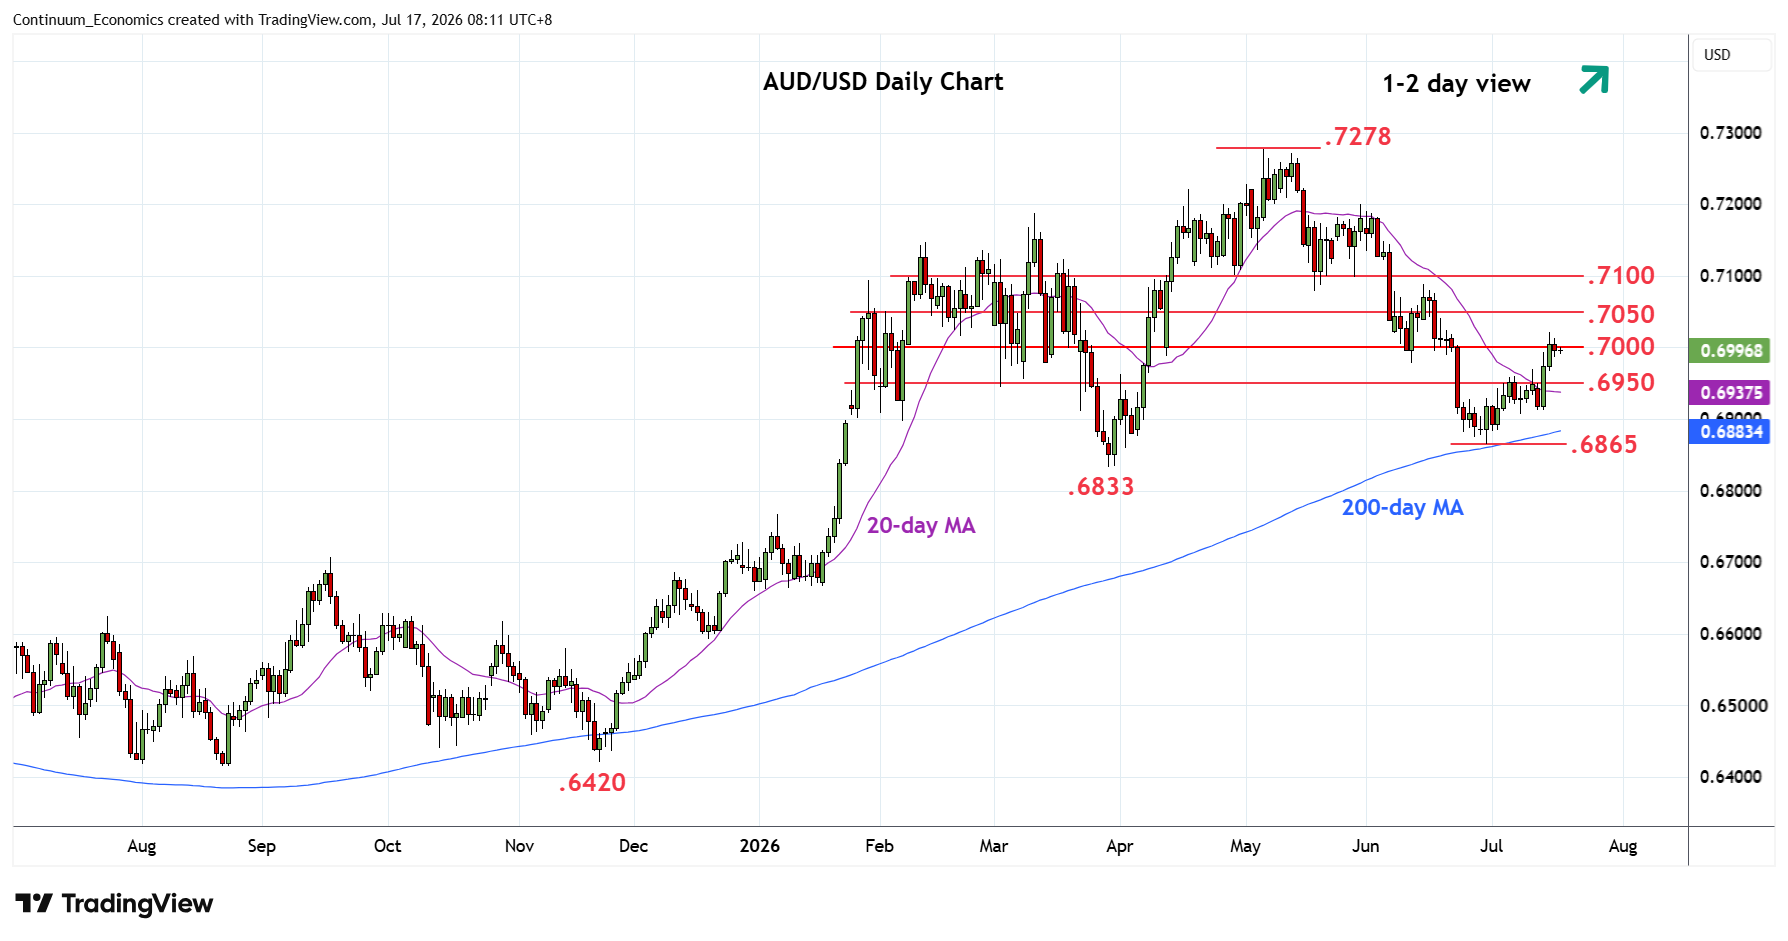
Chart AUD/USD Update: Consolidating test of .7020 Fibonacci level
2
Little change, as prices settled back from test of .7020 Fibonacci level to recent consolidate gains from .6912 low
| Levels | Imp | Comment | Levels | Imp | Comment | |||
|---|---|---|---|---|---|---|---|---|
| R4 | 0.7120 | * | 61.8% May/Jun fall | S1 | 0.6950 | * | congestion | |
| R3 | 0.7100 | ** | congestion | S2 | 0.6912/00 | * | 14 Jul low, congestion | |
| R2 | 0.7070/80 | * | 50%, May low | S3 | 0.6865 | ** | Jun low | |
| R1 | 0.7020 | * | 38.2% May/Jun fall | S4 | 0.6833 | ** | Mar low |
Asterisk denotes strength of level
00:10 GMT - Little change, as prices settled back from test of .7020 Fibonacci level to consolidate recent gains from .6912 low. Intraday studies are unwinding overbought readings but positive daily and weekly studies suggest this giving way to renewed buying interest later. Higher will see extension to strong resistance at the .7080/.7100 area where reaction is expected. Gains above here, if seen, will turn focus to the .7200 level then .7278, May current year high. Meanwhile, support remains at .6950 congestion which should underpin and sustain gains from the .6865 low.