Published: 2026-08-21T00:47:04.000Z
Chart NZD/USD Update: Focus turn to .5995, May high
1
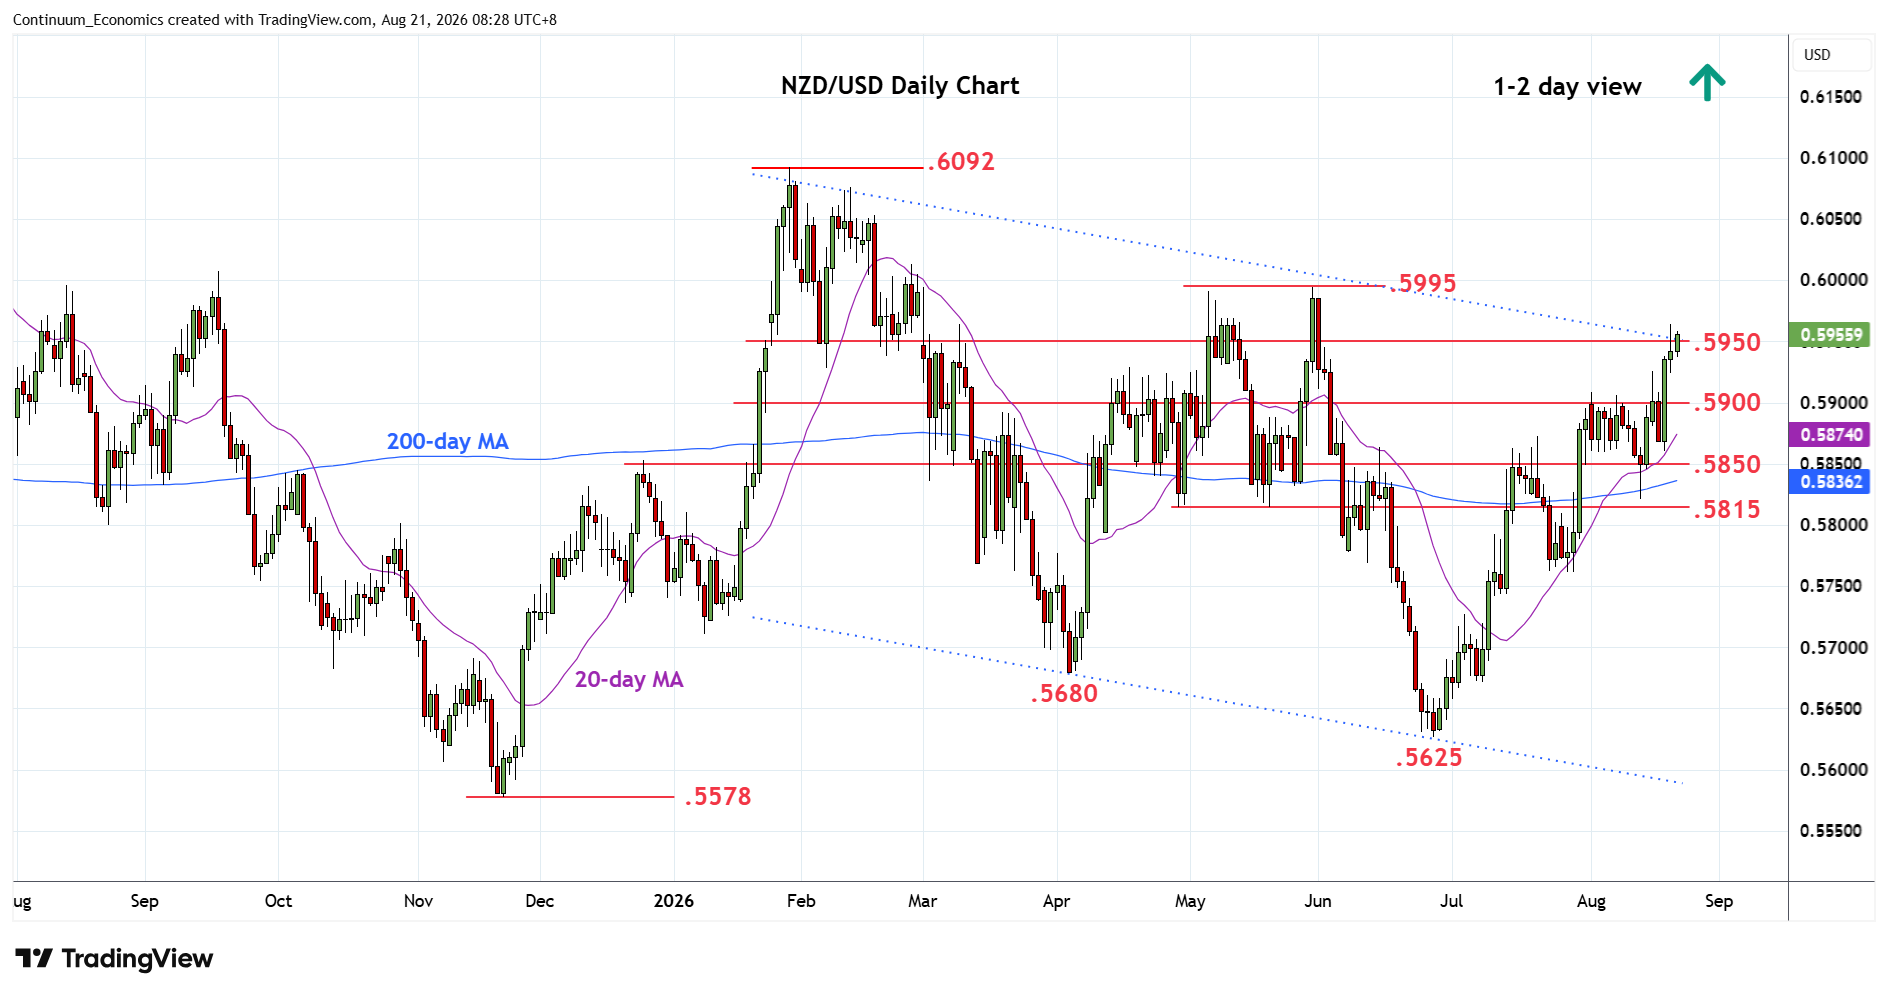
Extending break of the .5900 level to pressure resistance at .5950 and channel resistance from January high
| Levels | Imp | Comment | Levels | Imp | Comment | |||
|---|---|---|---|---|---|---|---|---|
| R4 | .6050 | * | congestion | S1 | .5900 | * | congestion | |
| R3 | .6000/13 | * | congestion, 26 Feb high | S2 | .5860/50 | * | 19 Aug low, congestion | |
| R2 | .5995 | ** | May high | S3 | .5820/15 | ** | 13 Aug, May lows | |
| R1 | .5964 | * | 20 Aug high | S4 | .5762 | ** | 29 Jul low |
Asterisk denotes strength of level
00:40 GMT - Extending break of the .5900 level to pressure resistance at .5950 and channel resistance from January high. Bullish momentum keep pressure on the upside and see room to extend the broader gains from .5625 June YTD low. Focus now turn to the May high at .5995 and the .6000 figure where reaction can be expected as daily and weekly extend into overbought areas. Meanwhile, support remains at the .5900 level which should underpin and sustain bullish bounce from the recent .5860 and .5820, the 19/13 August higher lows.