Chart USD Index DXY Update: Leaning lower
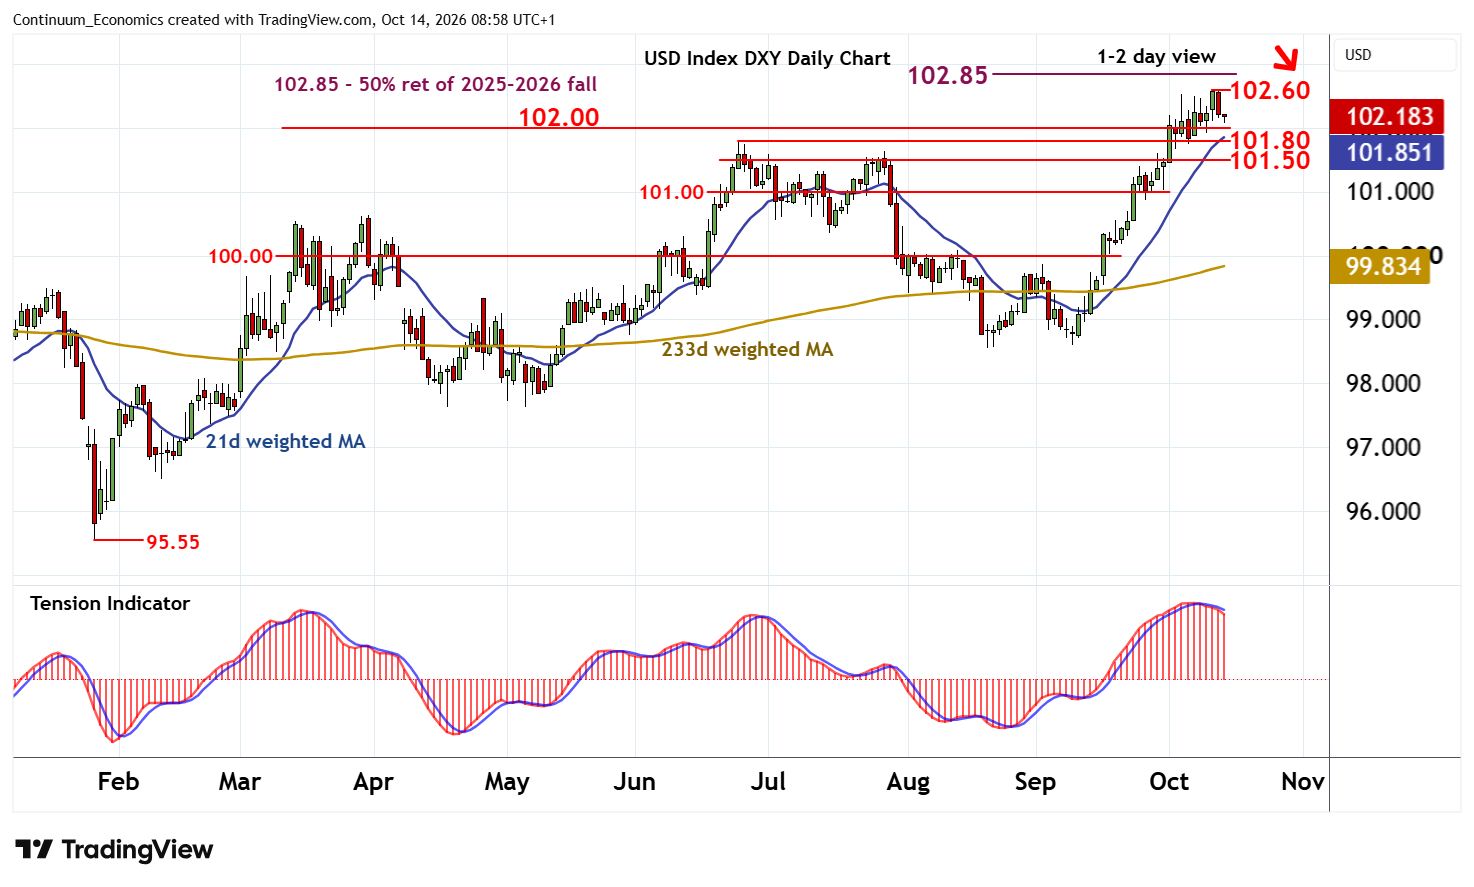
Anticipated losses are giving way to short-term consolidation just above support at the 101.80 monthly high of 24 June and congestion around 102.00
| Levels | Imp | Comment | Levels | Imp | Comment | |||
|---|---|---|---|---|---|---|---|---|
| R4 | 103.50 | * | congestion | S1 | 102.00 | ** | congestion | |
| R3 | 103.00 | ** | congestion | S2 | 101.80 | * | 24 Jun (m) high | |
| R2 | 102.85 | ** | 50% ret of 2025-2026 fall | S3 | 101.50 | * | range highs | |
| R1 | 102.60 | ** | 12 Oct YTD high | S4 | 101.00 | ** | congestion |
Asterisk denotes strength of level
08:45 BST - Anticipated losses are giving way to short-term consolidation just above support at the 101.80 monthly high of 24 June and congestion around 102.00. Daily stochastics and the daily Tension Indicator continue to track lower, highlighting room for a test beneath here. But rising weekly charts should limit any deeper losses in renewed buying interest/consolidation above the 101.50 range highs.
Following cautious/corrective trade, fresh gains are looked for. Resistance remains at the 102.60 current year high of 12 October. A later break will extend broad January gains towards the 102.85 Fibonacci retracement. A further close above here will confirm continuation of broad January gains.