Published: 2026-06-11T00:24:40.000Z
Chart AUD/USD Update: Lower through the .7000 figure
1
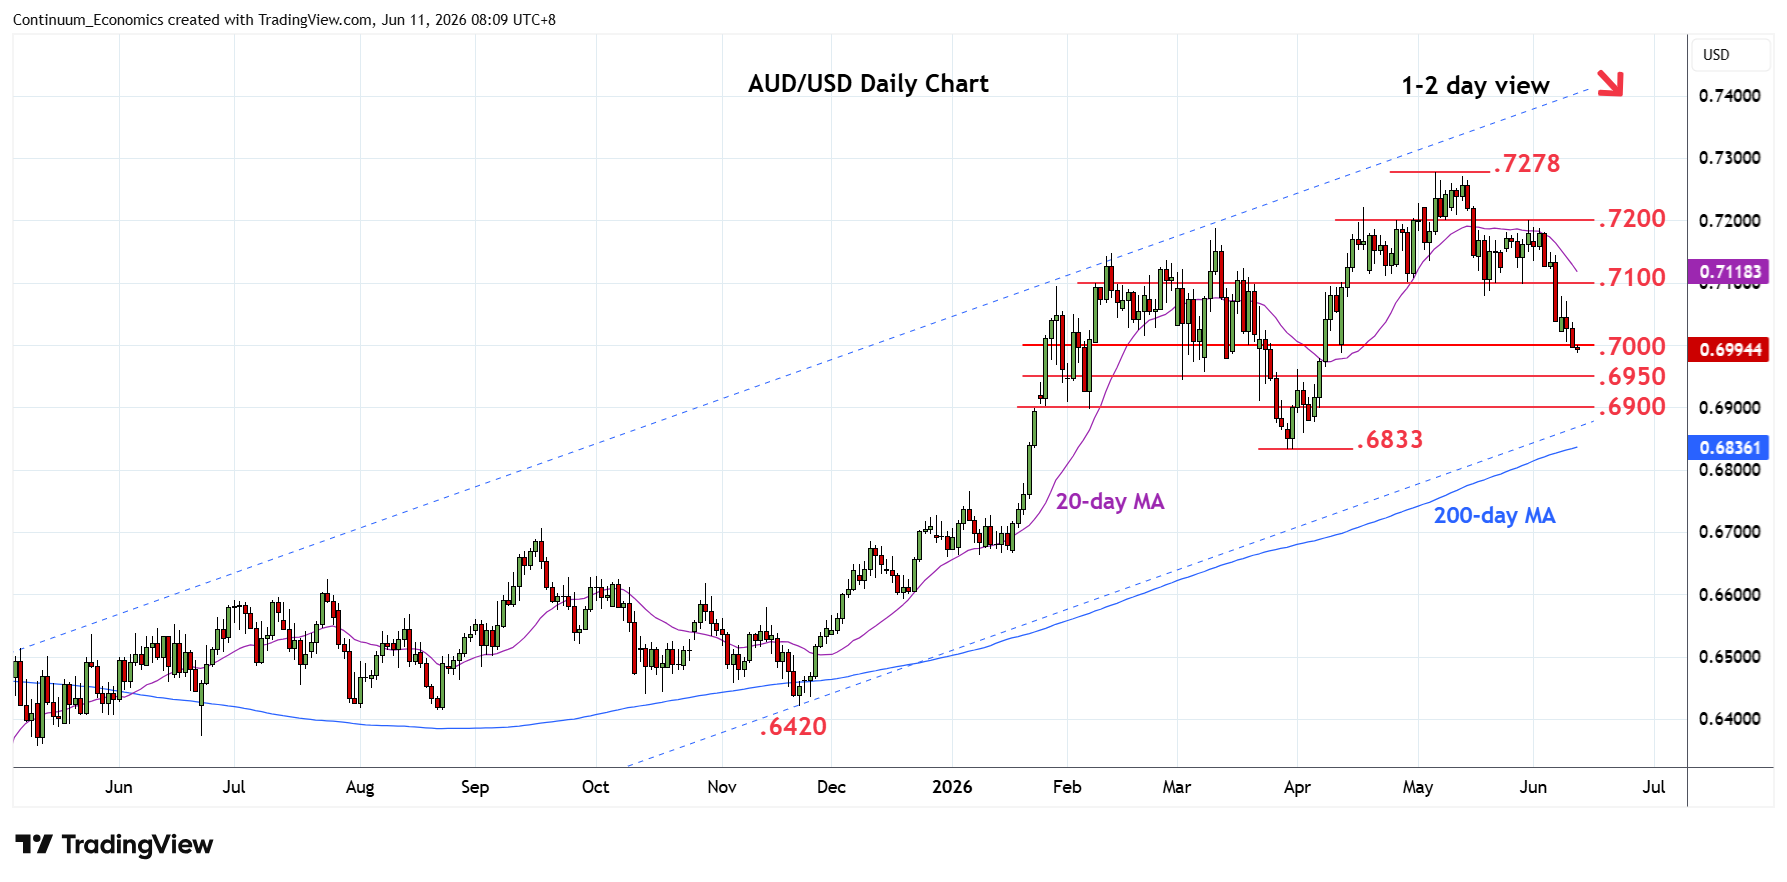
Under pressure as prices extend break of support at the .7000 figure and losses from the .7278, May YTD high
| Levels | Imp | Comment | Levels | Imp | Comment | |||
|---|---|---|---|---|---|---|---|---|
| R4 | 0.7150 | * | congestion | S1 | 0.6950 | * | congestion | |
| R3 | 0.7100 | ** | congestion | S2 | 0.6900 | * | congestion | |
| R2 | 0.7080 | * | May low | S3 | 0.6870 | * | Apr 2025 channel | |
| R1 | 0.7050 | congestion | S4 | 0.6833 | ** | Mar low, 200-day MA |
Asterisk denotes strength of level
00:15 GMT - Under pressure as prices extend break of support at the .7000 figure and losses from the .7278, May YTD high. Lower will further retrace the March/May rally and see room to support at the .6950/.6900 congestion area. Below these, if seen, turn focus to strong support area at .6870/.6833, being lower channel from the April 2025 and March low. Meanwhile, resistance is lowered to .7050 congestion and this extend to the .7080/.7100 area. Would need to regain the latter to fade the downside pressure and see room for stronger recovery.