Monthly US Chart 10 Year Yield: Turning away from 19-year highs
Anticipated gains have posted a fresh 19-year high at 5.365%, before falling steadily towards support at 5.000%
Anticipated gains have posted a fresh 19-year high at 5.365%, before falling steadily towards support at 5.000%.
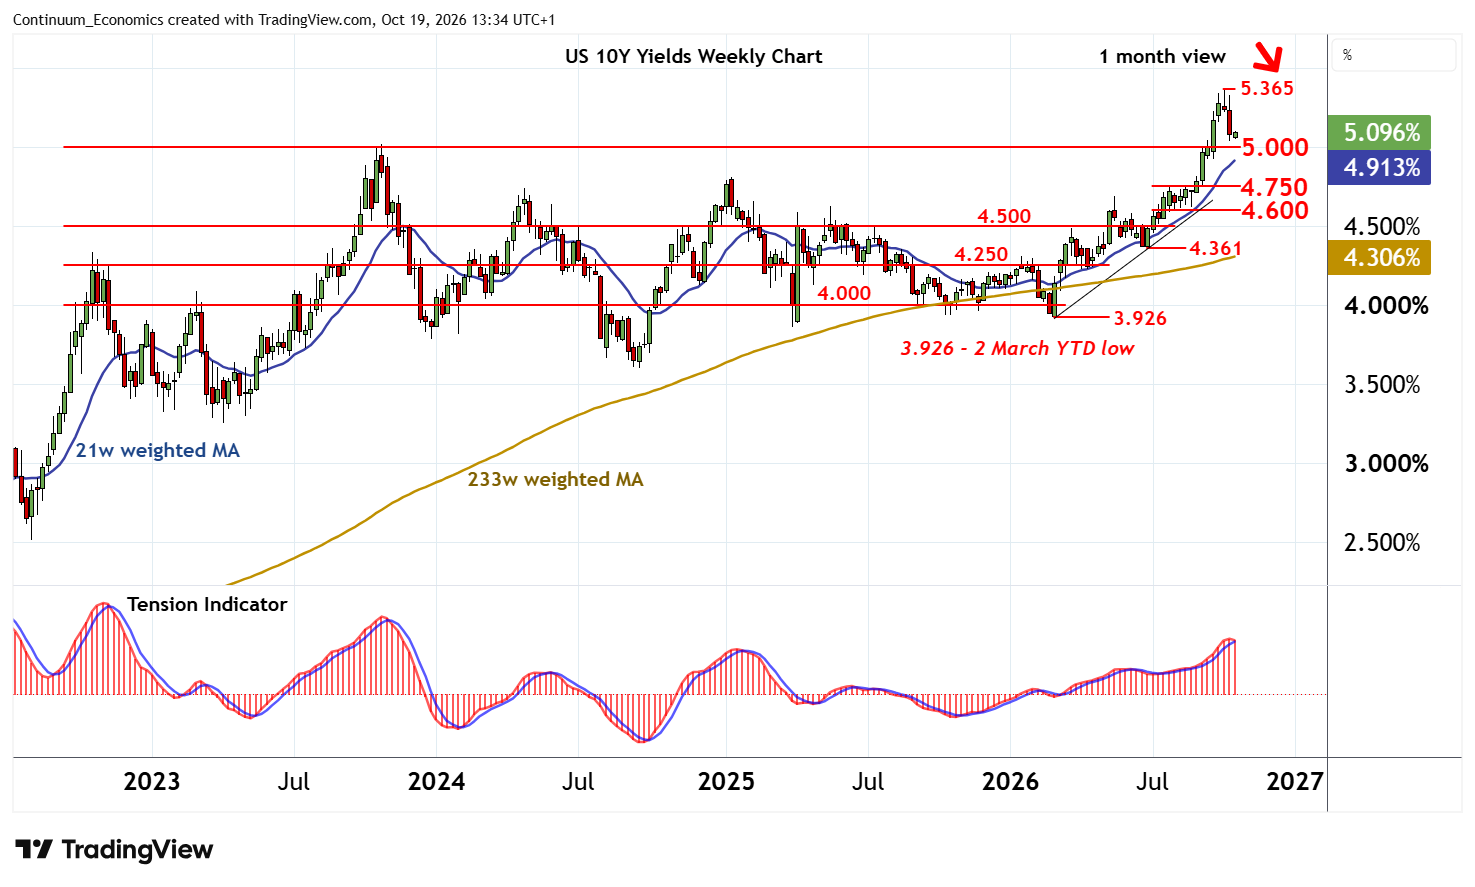
Overbought weekly stochastics are unwinding and the positive weekly Tension Indicator is turning down, highlighting a deterioration in price action and room for a deeper pullback into the coming weeks.
A close below 5.000% will add weight to sentiment and open up support at the 4.750% range highs from July-August. Unwinding overbought monthly stochastics highlight potential for a deeper retracement. But the positive monthly Tension Indicator and improving longer-term charts should limit scope in range extension above the 4.600% range lows.
Meanwhile, resistance is at the 5.289% year high of June 2007 and extends to the 5.365% current year high of 7 October.
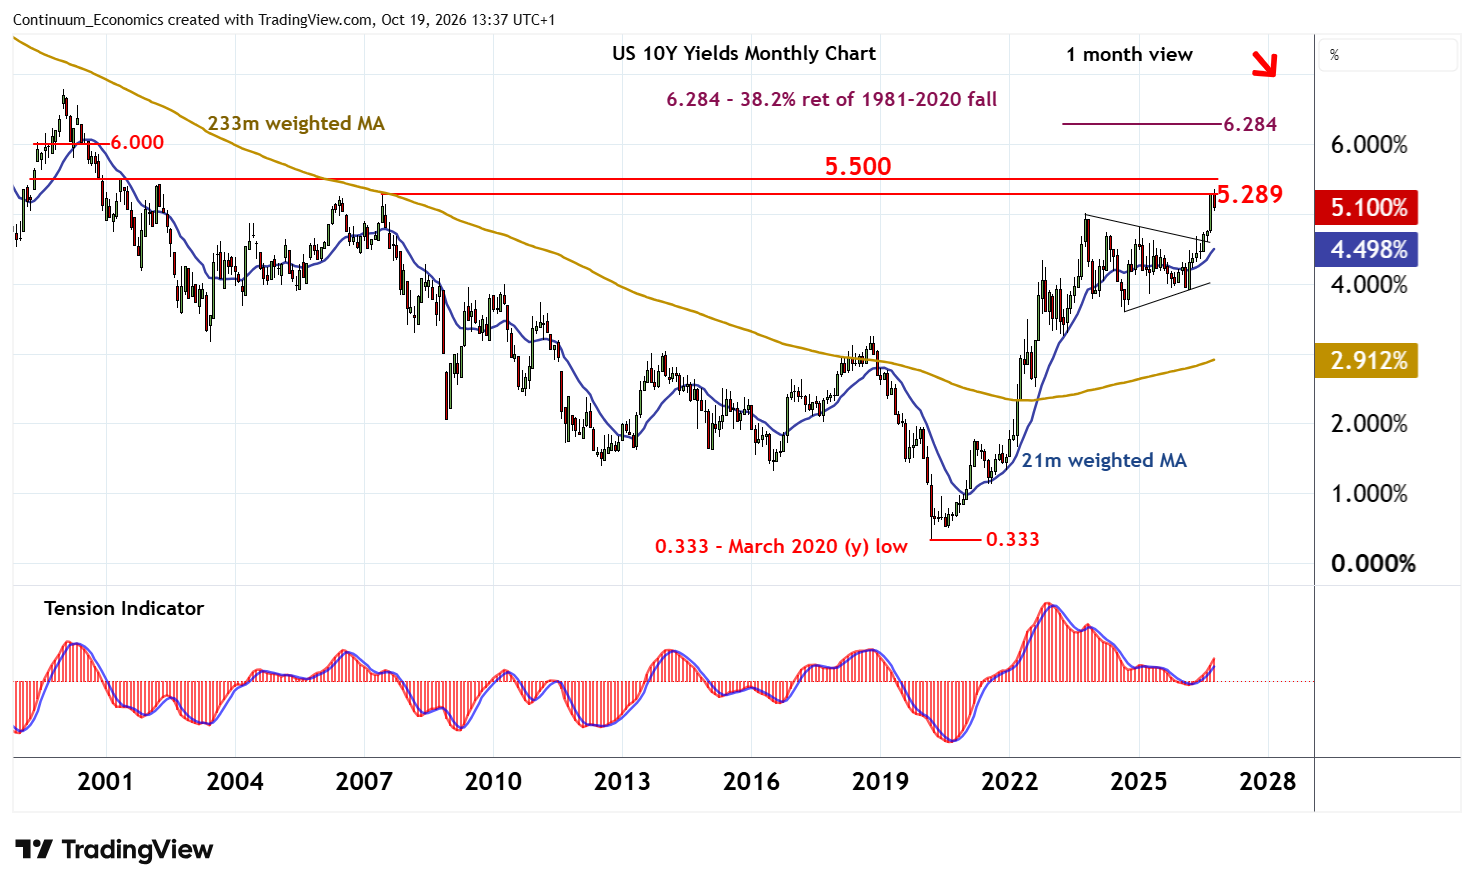
A close above here is needed, not yet seen, to improve sentiment and confirm continuation of the March 2020 bull trend.
Focus will then turn to congestion around 5.000%, with room for continuation towards historic congestion around the psychological 6.000% level.