Published: 2026-09-24T01:06:58.000Z
Chart USD/JPY Update: Extending gains, but stretched
3
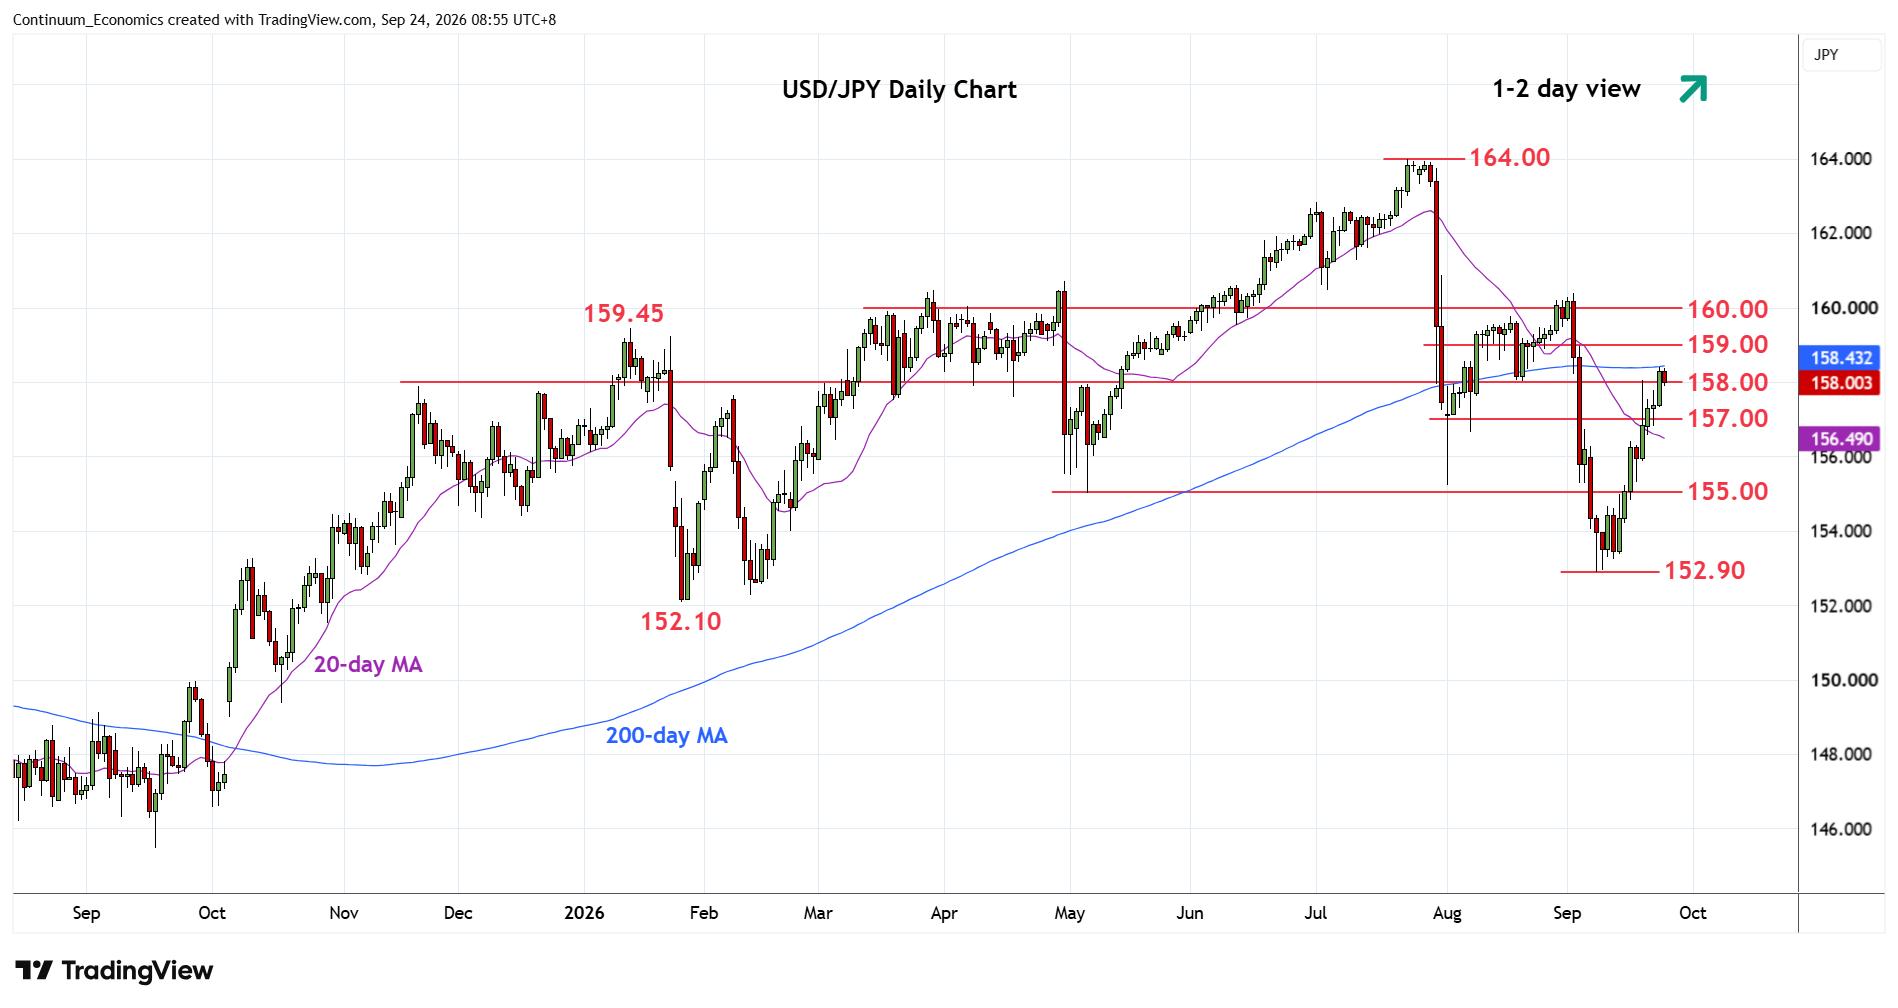
Break above the 158.00 level has seen gains to reach resistance at 158.40, 200-day MA and 50% Fibonacci level
| Levels | Imp | Comment | Levels | Imp | Comment | |||
|---|---|---|---|---|---|---|---|---|
| R4 | 159.75 | * | 61.8% Jul/Sep fall | S1 | 157.00 | * | congestion | |
| R3 | 159.45 | * | Jan high | S2 | 156.50/00 | * | congestion | |
| R2 | 159.00 | * | congestion | S3 | 155.00 | ** | May low | |
| R1 | 158.40 | * | 200-day MA, 50% | S4 | 154.67 | * | 10 Sep high |
Asterisk denotes strength of level
01:00 GMT - Break above the 158.00 level has seen gains to reach resistance at 158.40, 200-day MA and 50% Fibonacci level. Pause here see prices unwinding the stretched intraday and daily studies but a later break cannot be ruled out to extend strong gains from the 152.90 low. Higher will see room for extension to resistance at the 159.00/45 congestion and January high. Meanwhile, support is raised to 157.00 congestion. Would take break here to ease the upside pressure and see room for pullback to support at the 156.50/156.00 area and 155.00 May low.