Published: 2026-11-13T01:10:52.000Z
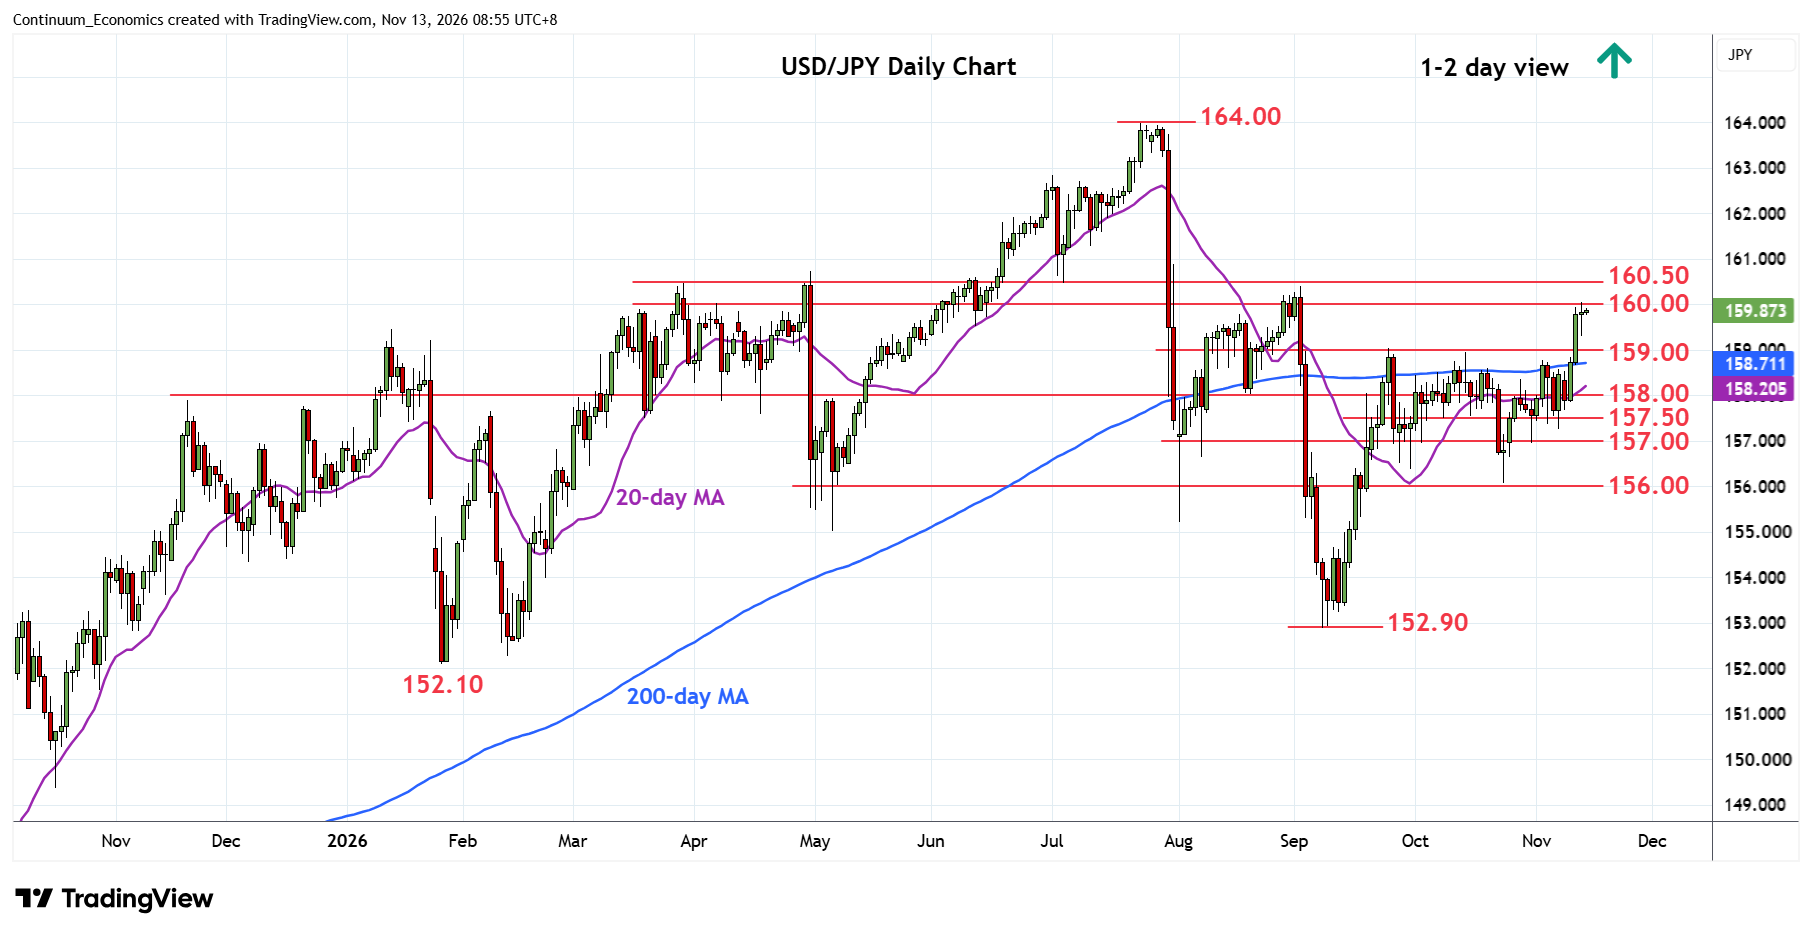
Chart USD/JPY Update: Pressuring 160.00 level
1
Settled back in consolidation after failing to sustain marginal break of the 160.00 figure
| Levels | Imp | Comment | Levels | Imp | Comment | |||
|---|---|---|---|---|---|---|---|---|
| R4 | 161.95 | ** | Jul 2024 year high | S1 | 159.00 | ** | congestion | |
| R3 | 161.00 | * | figure, congestion | S2 | 158.77 | * | 3 Nov high | |
| R2 | 160.40/50 | * | Sep high, congestion | S3 | 158.00 | * | congestion | |
| R1 | 160.00 | ** | figure, congestion | S4 | 157.50/00 | * | congestion |
Asterisk denotes strength of level
01:00 GMT - Settled back in consolidation after failing to sustain marginal break of the 160.00 figure. However, pressure remains on the upside and suggest scope for break here to further extend the September gains. Higher will see room to resistance at the 160.40/160.50, September high and congestion area. Meanwhile, recent highs at 159.00 and 158.77 now turned support should underpin and limit immediate corrective pullback. Would take break here to ease the upside pressure and see deeper pullback to the 158.00/157.00 congestion.