Weekly Chart USD Index DXY: Extending June losses
Consolidation within the 99.50 - 100.00 range has given way to anticipated selling interest
Consolidation within the 99.50 - 100.00 range has given way to anticipated selling interest,
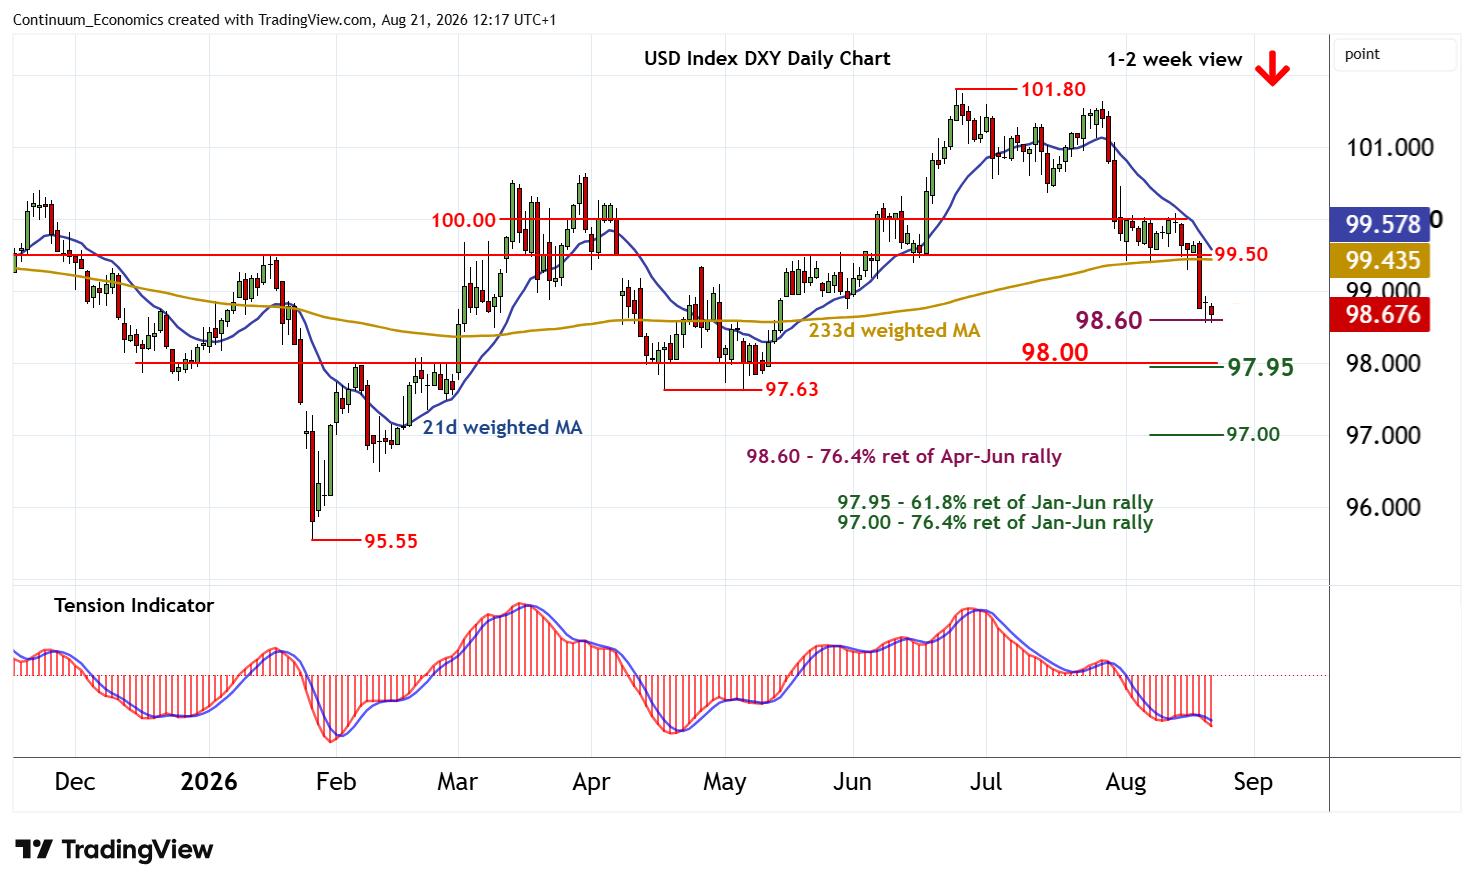
with prices currently pressuring support at the 98.60 Fibonacci retracement.
Daily readings have turned lower once again and broader weekly charts continue to fall, highlighting a bearish tone and room for still deeper losses in the coming week.
A close beneath here will add weight to already bearish price action and extend losses from the 101.80 current year high of 24 June towards strong support at the 97.95 longer-term Fibonacci retracement and congestion around 98.00. Just beneath here is the 97.63 low of April - May. But already oversold daily stochastics could limit any initial tests in short-covering/consolidation, before further losses unfold.
Meanwhile, resistance is lowered to congestion lows around 99.50 and extends to 100.00.
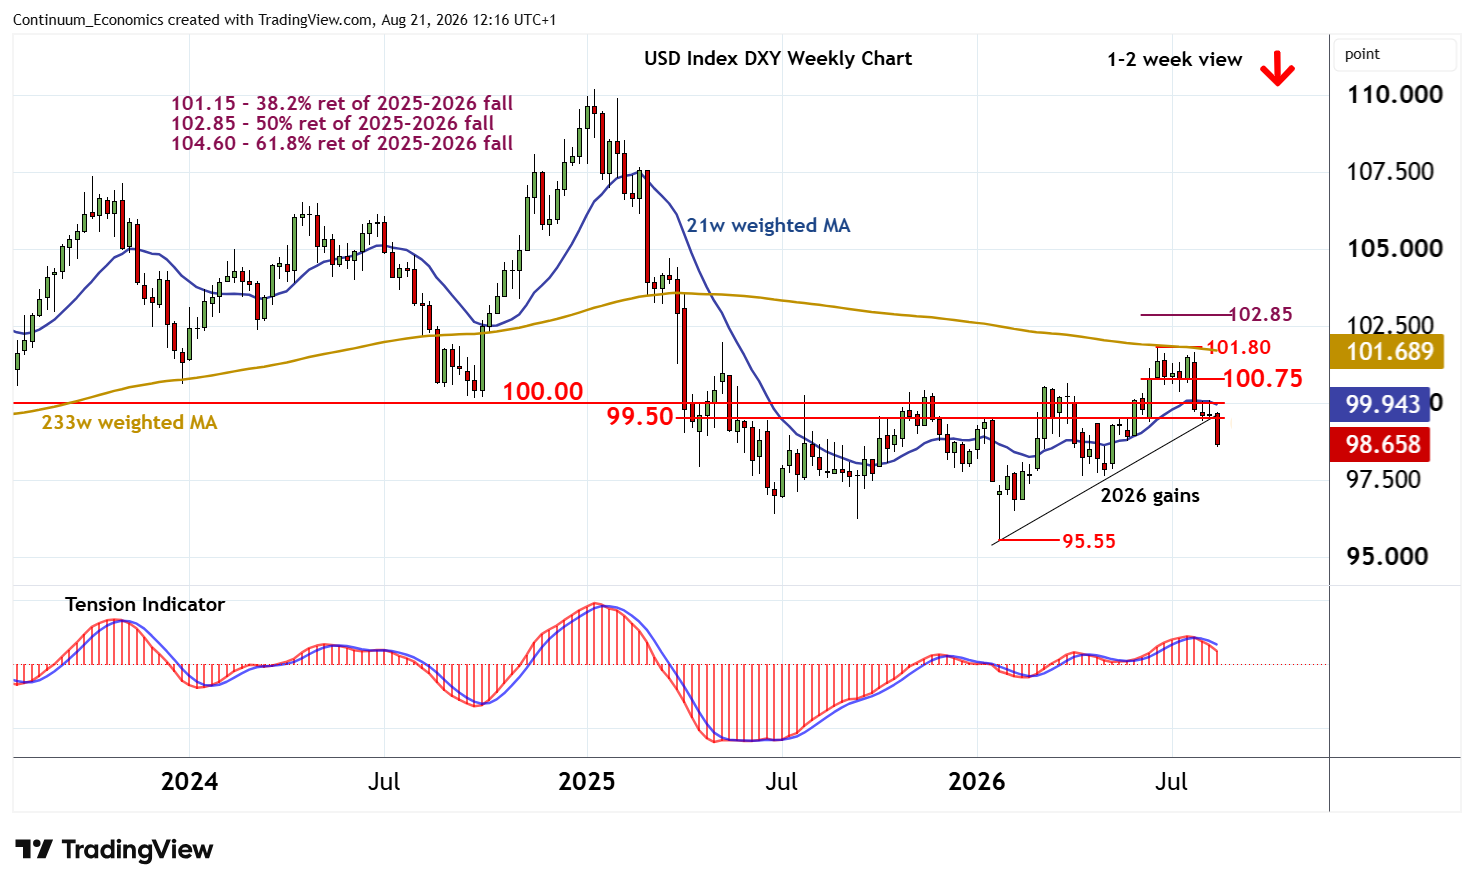
This range should cap any unexpected bounce.
A close above here, however, will improve sentiment and open up a test of the 100.75 base of the multi-week distribution top beneath 101.80.
However, deteriorating longer-term charts should prompt renewed selling interest into any break towards here.