Published: 2026-06-01T07:58:43.000Z
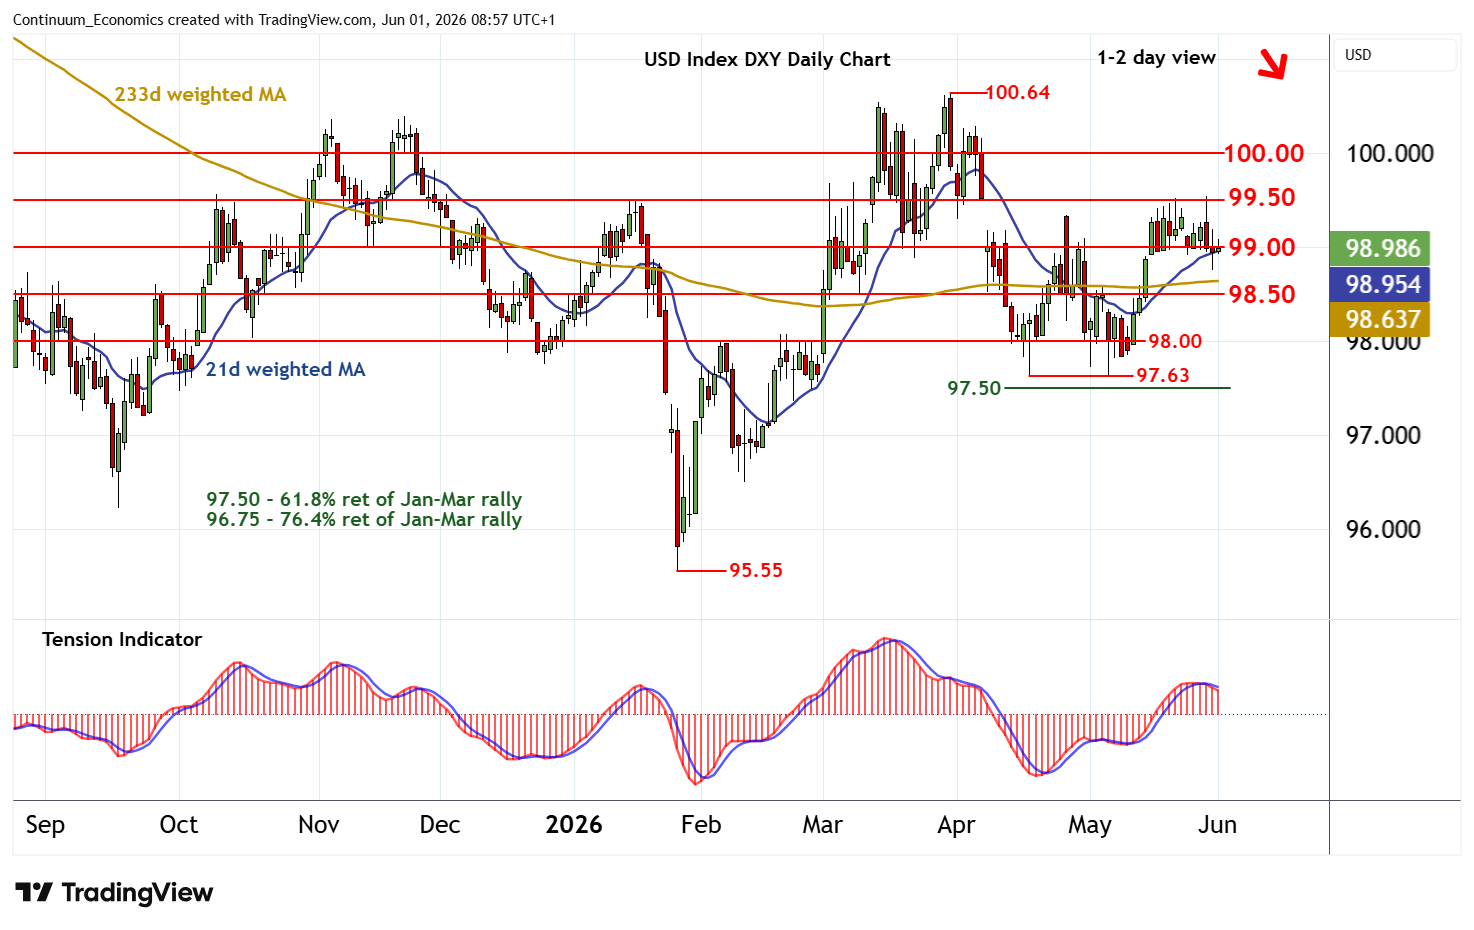
Chart USD Index DXY Update: Choppy trade - studies turning down
3
Cautious trade has given way to a spike down to 98.75
| Levels | Imp | Comment | Levels | Imp | Comment | |||
|---|---|---|---|---|---|---|---|---|
| R4 | 100.64 | ** | 31 Mar YTD high | S1 | 99.00 | * | congestion | |
| R3 | 100.29 | * | 6 Apr (m) high | S2 | 98.75 | 29 May (w) low | ||
| R2 | 100.00 | ** | congestion | S3 | 98.50 | * | congestion | |
| R1 | 99.50 | * | congestion, gap high | S4 | 98.00 | * | congestion |
Asterisk denotes strength of level
08:45 BST - Cautious trade has given way to a spike down to 98.75, before bouncing back into consolidation around 99.00 as oversold intraday studies unwind. Daily readings continue to track lower and broader weekly charts are coming under pressure, highlighting room for fresh losses in the coming sessions. Focus is expected to turn back to 98.75, with a break beneath here opening up congestion around 98.50. However, any immediate break beneath here should be limited in consolidation above 98.00, as daily stochastics become oversold. Meanwhile, resistance remains at 99.50 and should continue to cap any immediate tests higher.