Chart AUD/USD Update: Fresh year lows - approaching strong support
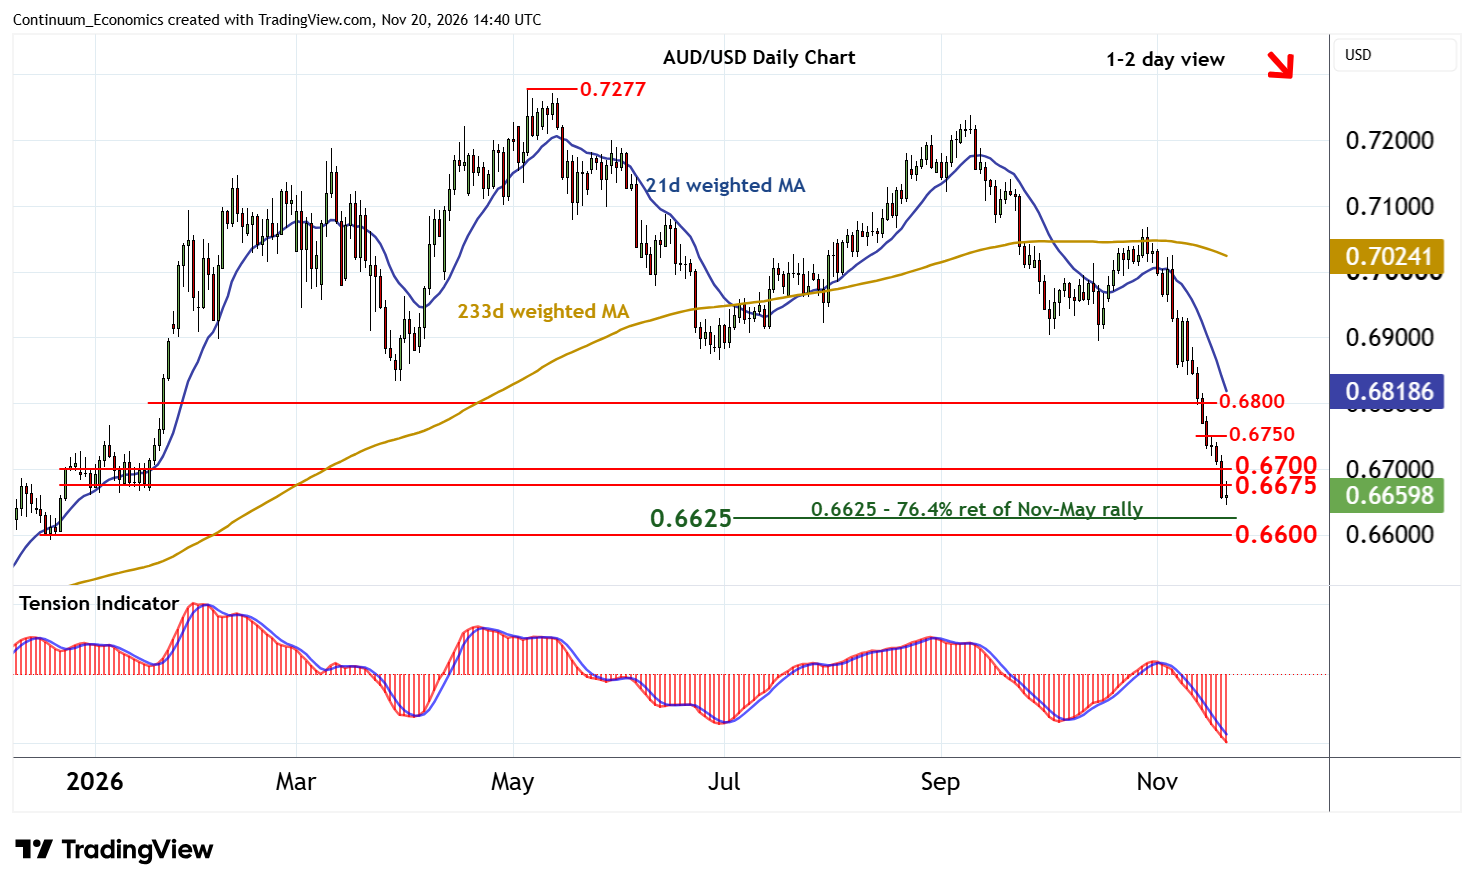
Anticipated losses have posted a fresh year low around 0.6645
| Levels | Imp | Comment | Levels | Imp | Comment | |||
|---|---|---|---|---|---|---|---|---|
| R4 | 0.6800 | break level | S1 | 0.6645 | fresh year low | |||
| R3 | 0.6750 | break level | S2 | 0.6625 | ** | 76.4% ret of Nov-May rally | ||
| R2 | 0.6700 | ** | congestion | S3 | 0.6595/00 | ** | late-Dec 25 (w) low; cong | |
| R1 | 0.6675 | * | January congestion lows | S4 | 0.6535 | * | December 2025 (m) low |
Asterisk denotes strength of level
14:25 GMT - Anticipated losses have posted a fresh year low around 0.6645, before settling into cautious trade around 0.6660 as intraday studies turn higher. The daily Tension Indicator continues to fall, suggesting room for continuation of losses from the 0.7277 current year high of 7 May towards the 0.6625 Fibonacci retracement. But flat oversold daily stochastics could limit any initial tests in short-covering/consolidation, before bearish weekly charts prompt a break.
Meanwhile, resistance is lowered to the 0.6675 congestion lows from January and extends to congestion around 0.6700. A close above here, if seen, would help to stabilise price action and give way to consolidation beneath 0.6750.