Published: 2026-06-24T07:20:00.000Z
Chart AUD/JPY Update: Extending losses
2
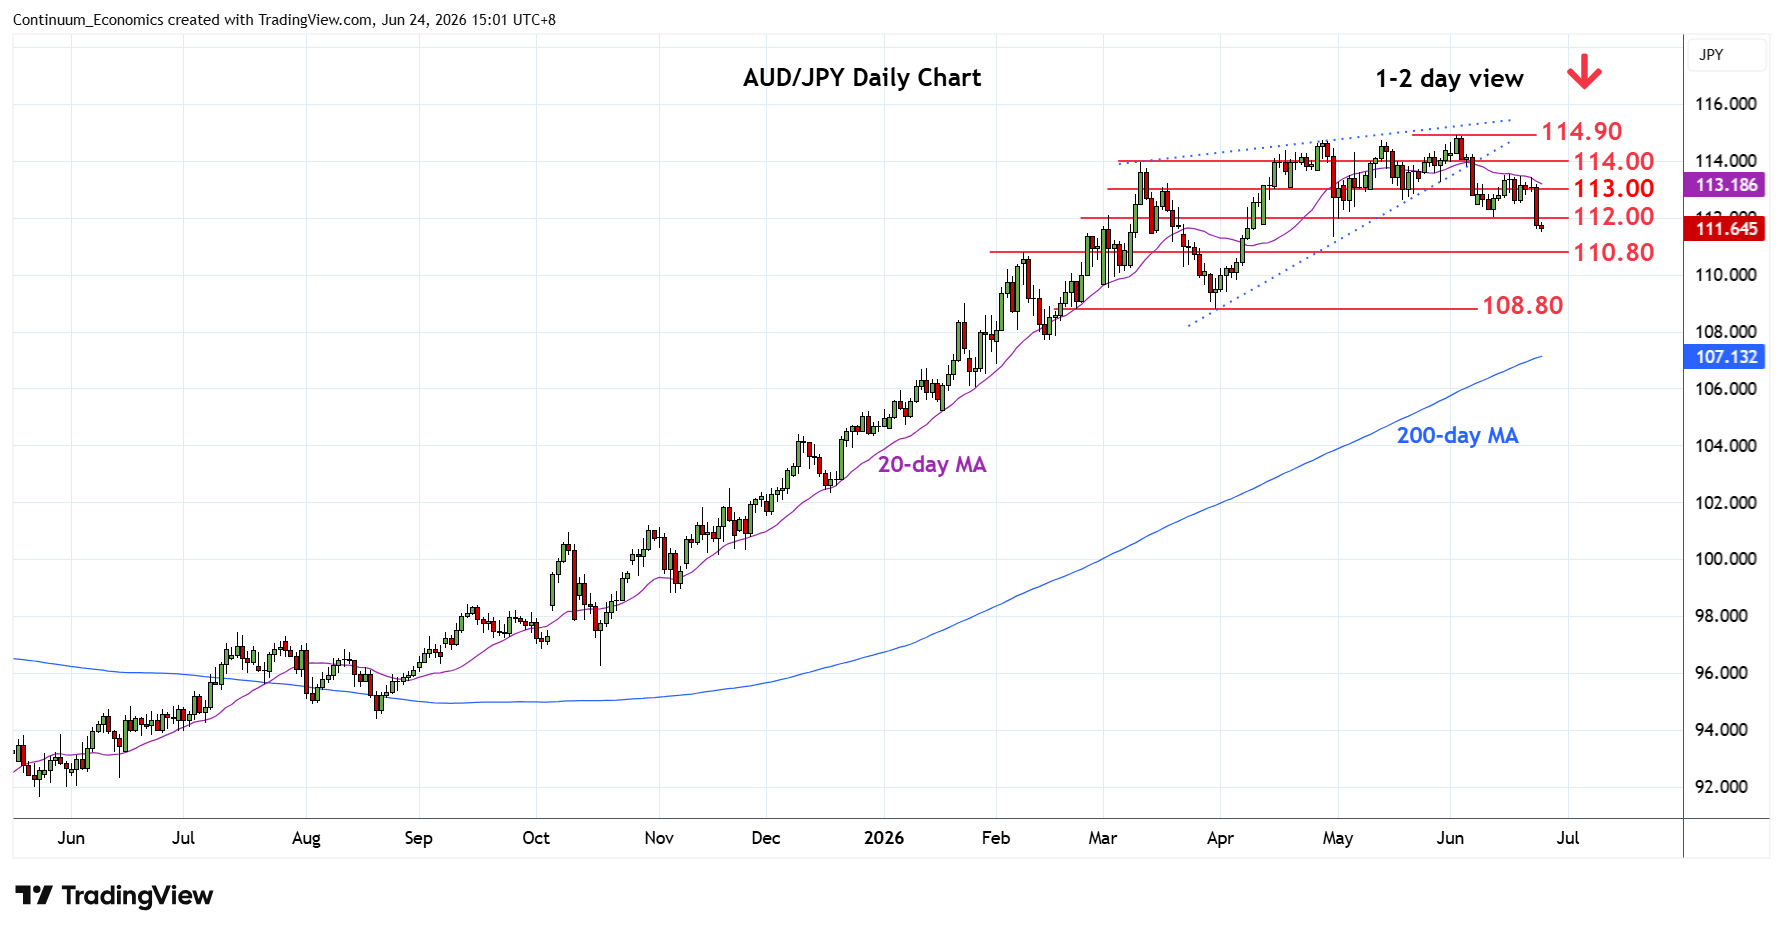
Consolidation at the 113.00 level has given way to sharp pullback through support at 112.00
| Levels | Imp | Comment | Levels | Imp | Comment | |||
|---|---|---|---|---|---|---|---|---|
| R4 | 114.90 | ** | 2 Jun YTD high | S1 | 111.30 | ** | 30 Apr low | |
| R3 | 114.00 | ** | congestion | S2 | 110.80 | * | 9 Feb high | |
| R2 | 113.50 | * | 15 Jun high | S3 | 110.00 | congestion | ||
| R1 | 113.00 | * | congestion | S4 | 108.80 | ** | Mar low |
Asterisk denotes strength of level
07:15 GMT - Consolidation at the 113.00 level has given way to sharp pullback through support at 112.00. Break here confirm a top in place at the 114.90 current year high of 2 June and see room for deeper pullback to retrace gains from the April 2025 low towards support at the 111.30/110.80 area. Lower still, will see extension to the 110.00 level and support at 108.80 March low. Meanwhile, resistance is lowered to the 113.00/113.50 congestion and 15 June high which is expected to cap and sustain losses from the 114.90 high.