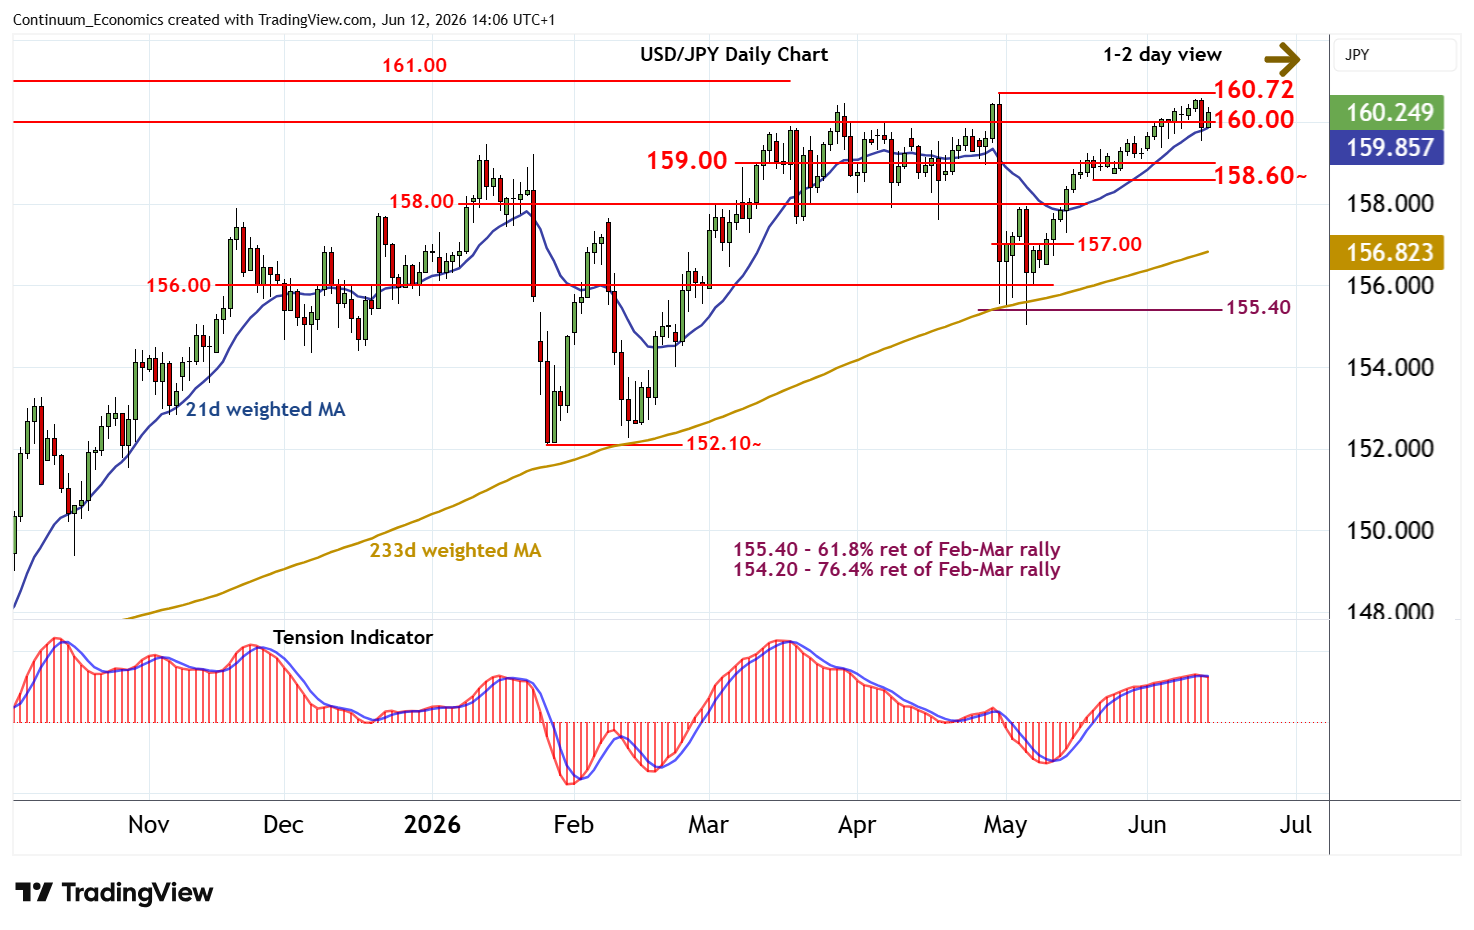
Chart USD/JPY Update: Choppy beneath the 160.72 current year high
Cautious trade beneath strong resistance at the 160.72 current year high of 30 April has given way to a sharp USD- and JPY-driven fall
| Levels | Imp | Comment | Levels | Imp | Comment | |||
|---|---|---|---|---|---|---|---|---|
| R4 | 161.95 | ** | July 2024 multi-year high | S1 | 160.00 | ** | congestion | |
| R3 | 161.00 | ** | Jun-Jul 2024 congestion | S2 | 159.50~ | 11 Jun low | ||
| R2 | 160.72 | ** | 30 Apr YTD high | S3 | 159.00 | * | congestion | |
| R1 | 160.60 | intraday high | S4 | 158.60~ | * | 20 May (w) low |
Asterisk denotes strength of level
13:45 BST - Cautious trade beneath strong resistance at the 160.72 current year high of 30 April has given way to a sharp USD- and JPY-driven fall, with prices reaching 159.50~ before bouncing back above 160.00. Overbought daily stochastics are unwinding and the flat daily Tension Indicator is turning down, highlighting room for further losses in the coming sessions. A close back below congestion support at 160.00 will add weight to sentiment and put focus on congestion around 159.00. However, positive weekly charts should limit any deeper losses in renewed buying interest/consolidation above the 158.60~ weekly low of 20 May. Meanwhile, a close above 160.72 would improve price action and extend September 2024 gains towards critical multi-year resistance at the 161.95 year high of July 2024.