Published: 2026-06-24T01:52:31.000Z
Chart EUR/USD Update: Extend January losses
-
Sharply lower through the 1.1410/00 support as prices extend losses from the January high
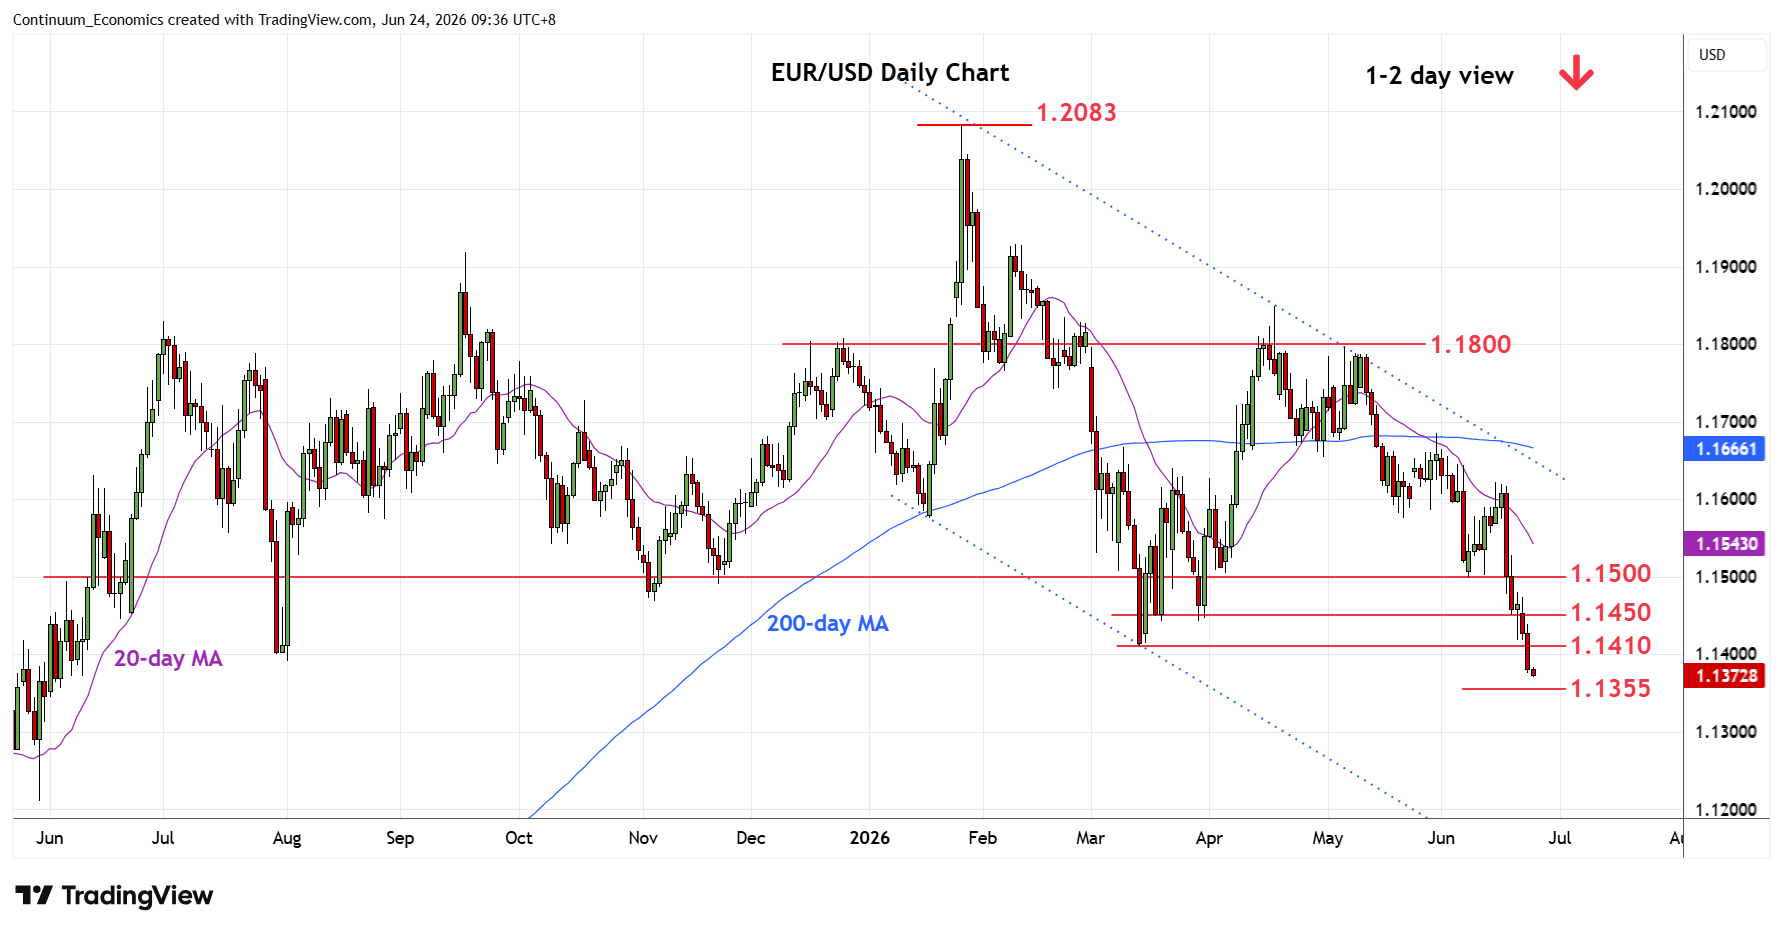
| Levels | Imp | Comment | Levels | Imp | Comment | |||
|---|---|---|---|---|---|---|---|---|
| R4 | 1.1550/75 | ** | congestion, May low | S1 | 1.1355 | * | 38.2% 2025/2026 rally | |
| R3 | 1.1500 | ** | 8 Jun low | S2 | 1.1300 | * | congestion | |
| R2 | 1.1450 | * | congestion | S3 | 1.1275 | * | 2023 year high | |
| R1 | 1.1400/10 | ** | congestion, Mar low | S4 | 1.1210/00 | ** | congestion, 2024 yr high |
Asterisk denotes strength of level
01:45 GMT - Sharply lower through the 1.1410/00 support as prices extend losses from the January high. Lower will see room to the 1.1355, 38.2% Fibonacci retracement, where stretched daily studies suggest reaction here likely. Failure here will open up room for further losses to support at 1.1300 congestion and 1.1275, 2023 year high. Meanwhile, support turned resistance at the 1.1400/10 congestion and March low now expected to cap corrrective bounce. Gains above here will ease the downside pressure and see room for stronger bounce to 1.1450/1.1500 area.