Chart USD/JPY Update: Leaning lower in both USD- and JPY-driven trade
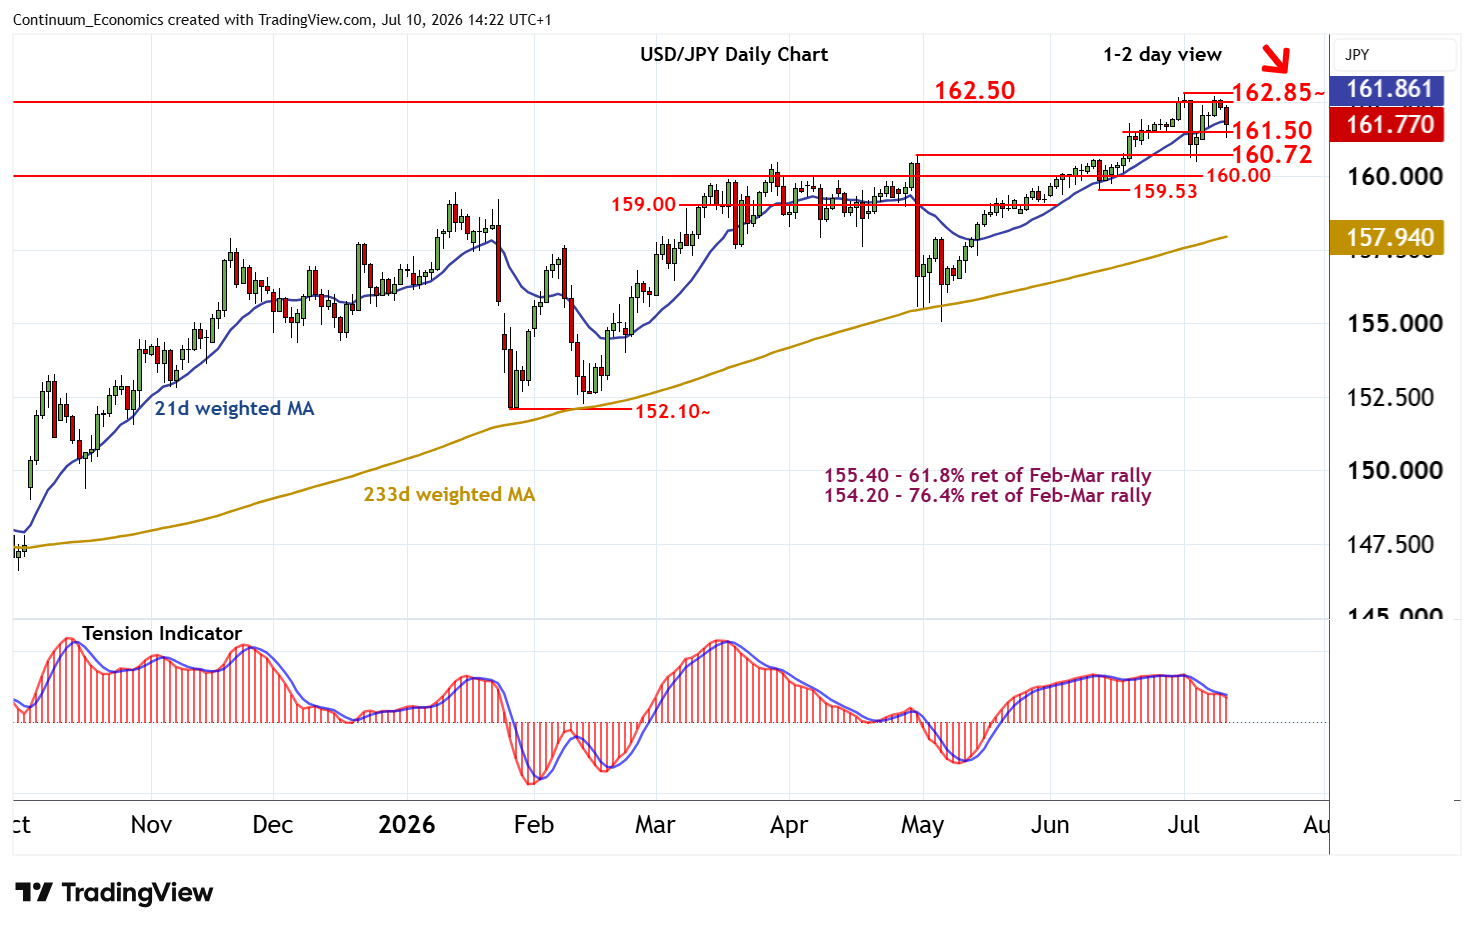
The USD- and JPY-driven test below 162.00 has met anticipated buying interest at 161.50
| Levels | Imp | Comment | Levels | Imp | Comment | |||
|---|---|---|---|---|---|---|---|---|
| R4 | 163.95 | ** | December 1986 high | S1 | 161.50 | * | intraday break level | |
| R3 | 163.00 | * | historic congestion | S2 | 161.00 | * | intraday lows | |
| R2 | 162.85~ | ** | 1 July multi-year high | S3 | 160.72 | * | 30 Apr (m) high | |
| R1 | 162.50 | historic congestion | S4 | 160.00 | ** | congestion |
Asterisk denotes strength of level
13:55 BST - The USD- and JPY-driven test below 162.00 has met anticipated buying interest at 161.50, as oversold intraday studies unwind, with prices currently trading around 161.80. Daily readings are coming under pressure and overbought weekly stochastics are turning down, highlighting room for further losses in the coming sessions. A later break back below 161.50 will open up the 160.72 monthly high of 30 April. A further close beneath here will add weight to sentiment and confirm continuation of July losses, initially to congestion around 160.00. Meanwhile, resistance remains at 162.50 and extends to the 162.85~ current year high of 1 July. A close above here would turn sentiment positive and extend long-term gains towards the 163.95 high of December 1986.