Chart EUR/USD Update: Limited tests higher
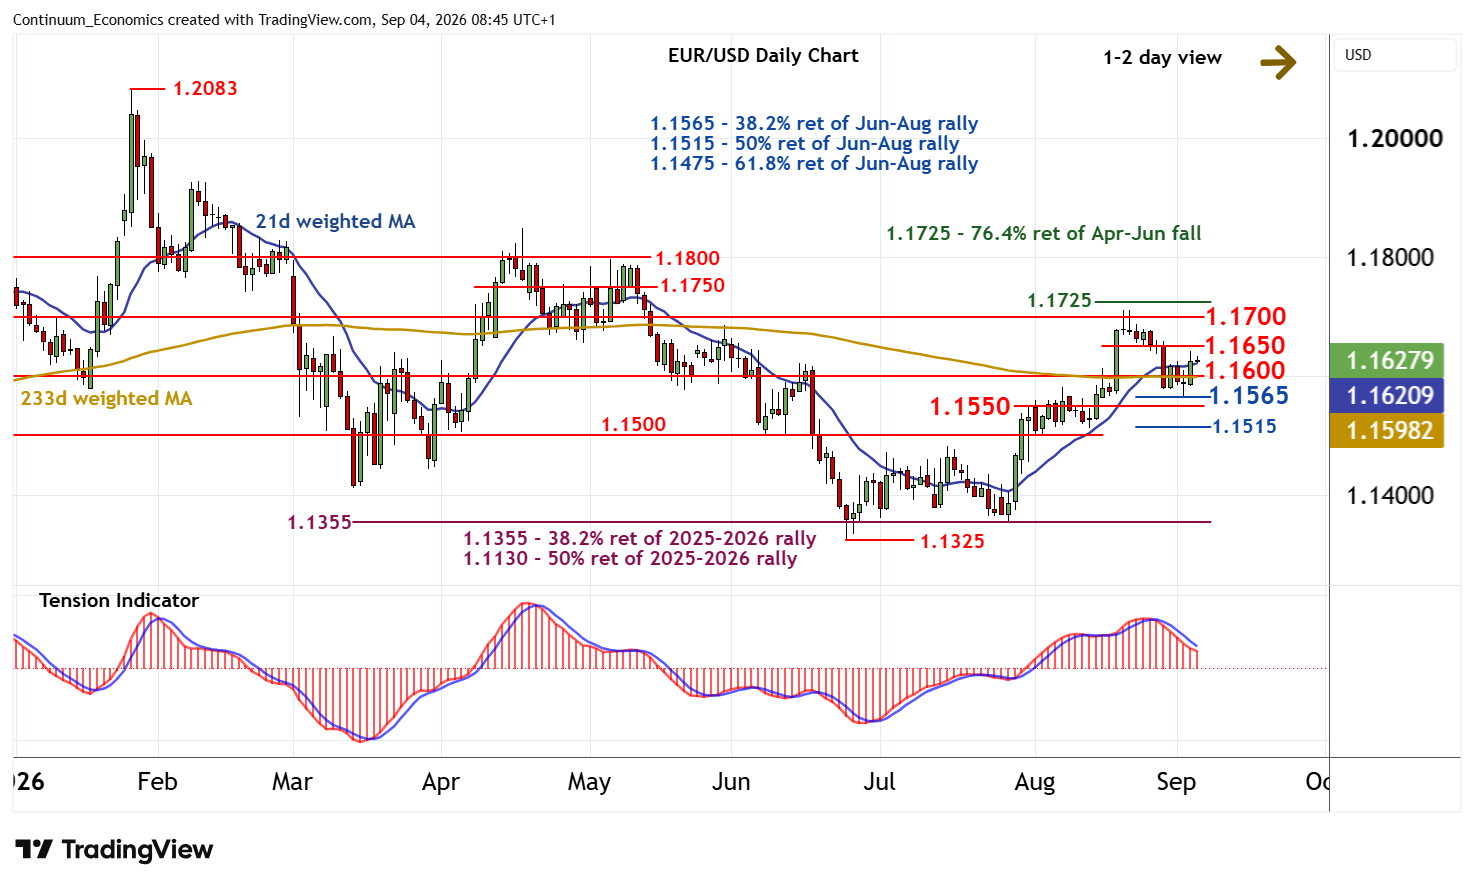
The bounce from support at the 1.1565 Fibonacci retracement has extended
| Levels | Imp | Comment | Levels | Imp | Comment | |||
|---|---|---|---|---|---|---|---|---|
| R4 | 1.1750 | * | congestion | S1 | 1.1600 | * | congestion | |
| R3 | 1.1725 | ** | 76.4% ret of Apr-Jun fall | S2 | 1.1565 | * | 38.2% ret of Jun-Aug rally | |
| R2 | 1.1700 | * | congestion | S3 | 1.1550 | * | congestion | |
| R1 | 1.1650 | recent range lows | S4 | 1.1515 | * | 50% ret of Jun-Aug rally |
*Asterisk denotes strength of level
08:35 BST - The bounce from support at the 1.1565 Fibonacci retracement has extended, with prices reaching 1.1640 before settling into consolidation around 1.1625. Oversold daily stochastics are ticking higher, suggesting room for a test of resistance at 1.1650. But the bearish daily Tension Indicator and mixed weekly charts should limit any further gains in renewed consolidation beneath congestion around 1.1700. A close above the 1.1725 Fibonacci retracement, however, will improve sentiment and confirm continuation of late-June gains.
Meanwhile, support is at congestion around 1.1600. But a close below 1.1565 would add weight to sentiment and extend late-August losses towards congestion around 1.1550. Already oversold daily stochastics could limit any initial tests in fresh consolidation.