Published: 2026-08-04T13:10:23.000Z
Chart AUD/USD Update: Cautious trade
2
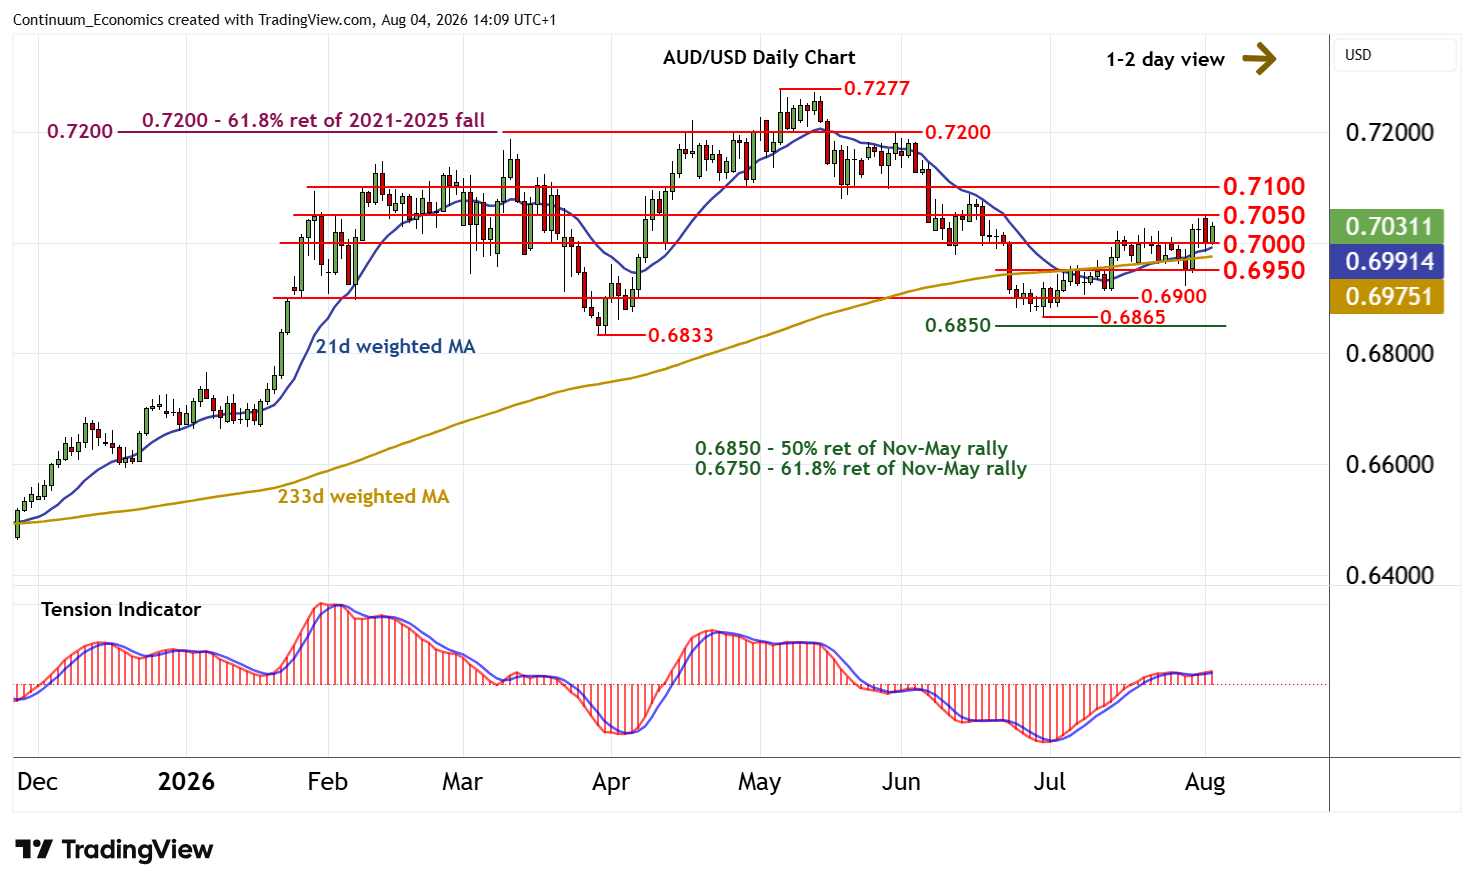
The test below congestion support at 0.7000 has bounced from 0.6985
| Levels | Imp | Comment | Levels | Imp | Comment | |||
|---|---|---|---|---|---|---|---|---|
| R4 | 0.7277 | ** | 6 May YTD high | S1 | 0.7000 | * | congestion | |
| R3 | 0.7200 | ** | congestion | S2 | 0.6950 | congestion | ||
| R2 | 0.7100 | ** | congestion | S3 | 0.6900 | * | congestion | |
| R1 | 0.7050 | * | congestion | S4 | 0.6865 | ** | 30 Jun (m) low |
Asterisk denotes strength of level
13:50 BST - The test below congestion support at 0.7000 has bounced from 0.6985, as oversold intraday studies unwind, with prices currently trading around 0.7035. A retest of congestion resistance at 0.7050 cannot be ruled out. But the positive daily Tension Indicator and overbought daily stochastics are flattening, suggesting any immediate break could be limited in renewed selling interest beneath further congestion around 0.7100. Meanwhile, any immediate tests below 0.7000 should give way to consolidation above congestion support at 0.6950.