Published: 2026-11-17T08:35:19.000Z
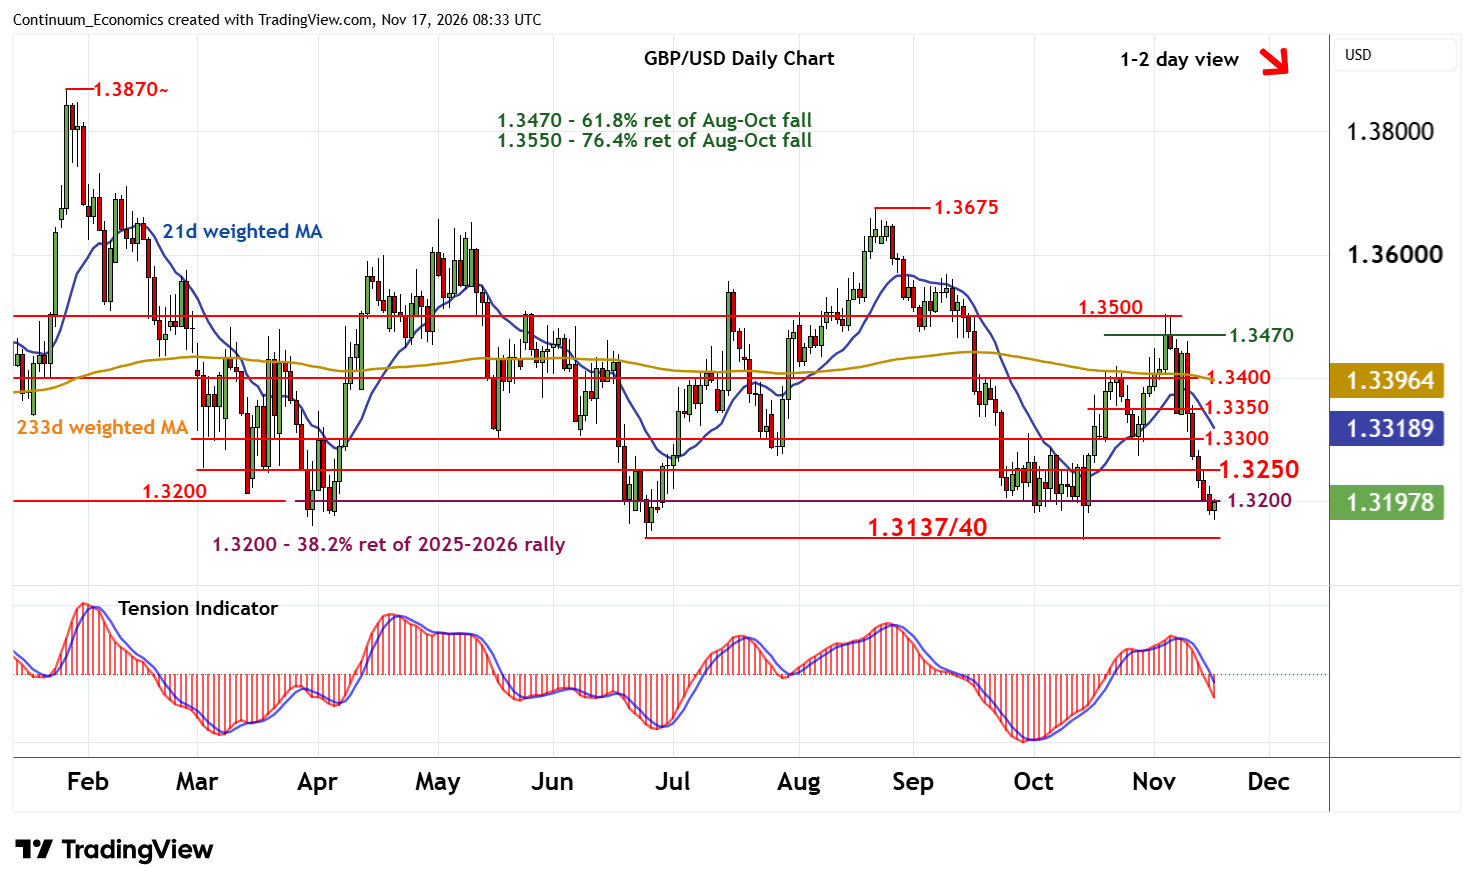
Chart GBP/USD Update: Room for consolidation before January losses extend
-
The break below 1.3200 has bounced from 1.3165/70
| Level | Comment | Level | Comment | |||||
|---|---|---|---|---|---|---|---|---|
| R4 | 1.3350 | break level | S1 | 1.3137/40 | ** | Jun-Oct YTD lows | ||
| R3 | 1.3300 | ** | congestion | S2 | 1.3100 | * | congestion | |
| R2 | 1.3250 | * | congestion | S3 | 1.3035~ | * | 20 Nov 2025 (w) low | |
| R1 | 1.3200 | ** | congestion | S4 | 1.3000/10 | ** | cong; November 2025 (m) low |
Asterisk denotes strength of level
08:10 GMT - The break below 1.3200 has bounced from 1.3165/70, as intraday studies turn higher and oversold daily stochastics flatten, with prices currently pressuring 1.3200. A break above here cannot be ruled out. But the bearish daily Tension Indicator and negative weekly charts should limit scope in renewed selling interest beneath further congestion around 1.3250.
Following cautious/corrective trade, fresh losses are looked for. A later close below critical support at the 1.3137/40 current year lows from June-October will add weight to sentiment and extend losses from the 1.3870 current year high of 27 January towards critical support around 1.3000/10.