Published: 2026-11-04T06:09:13.000Z
Chart AUD/NZD Update: Room for deeper pullback from 1.2600 current year high
1
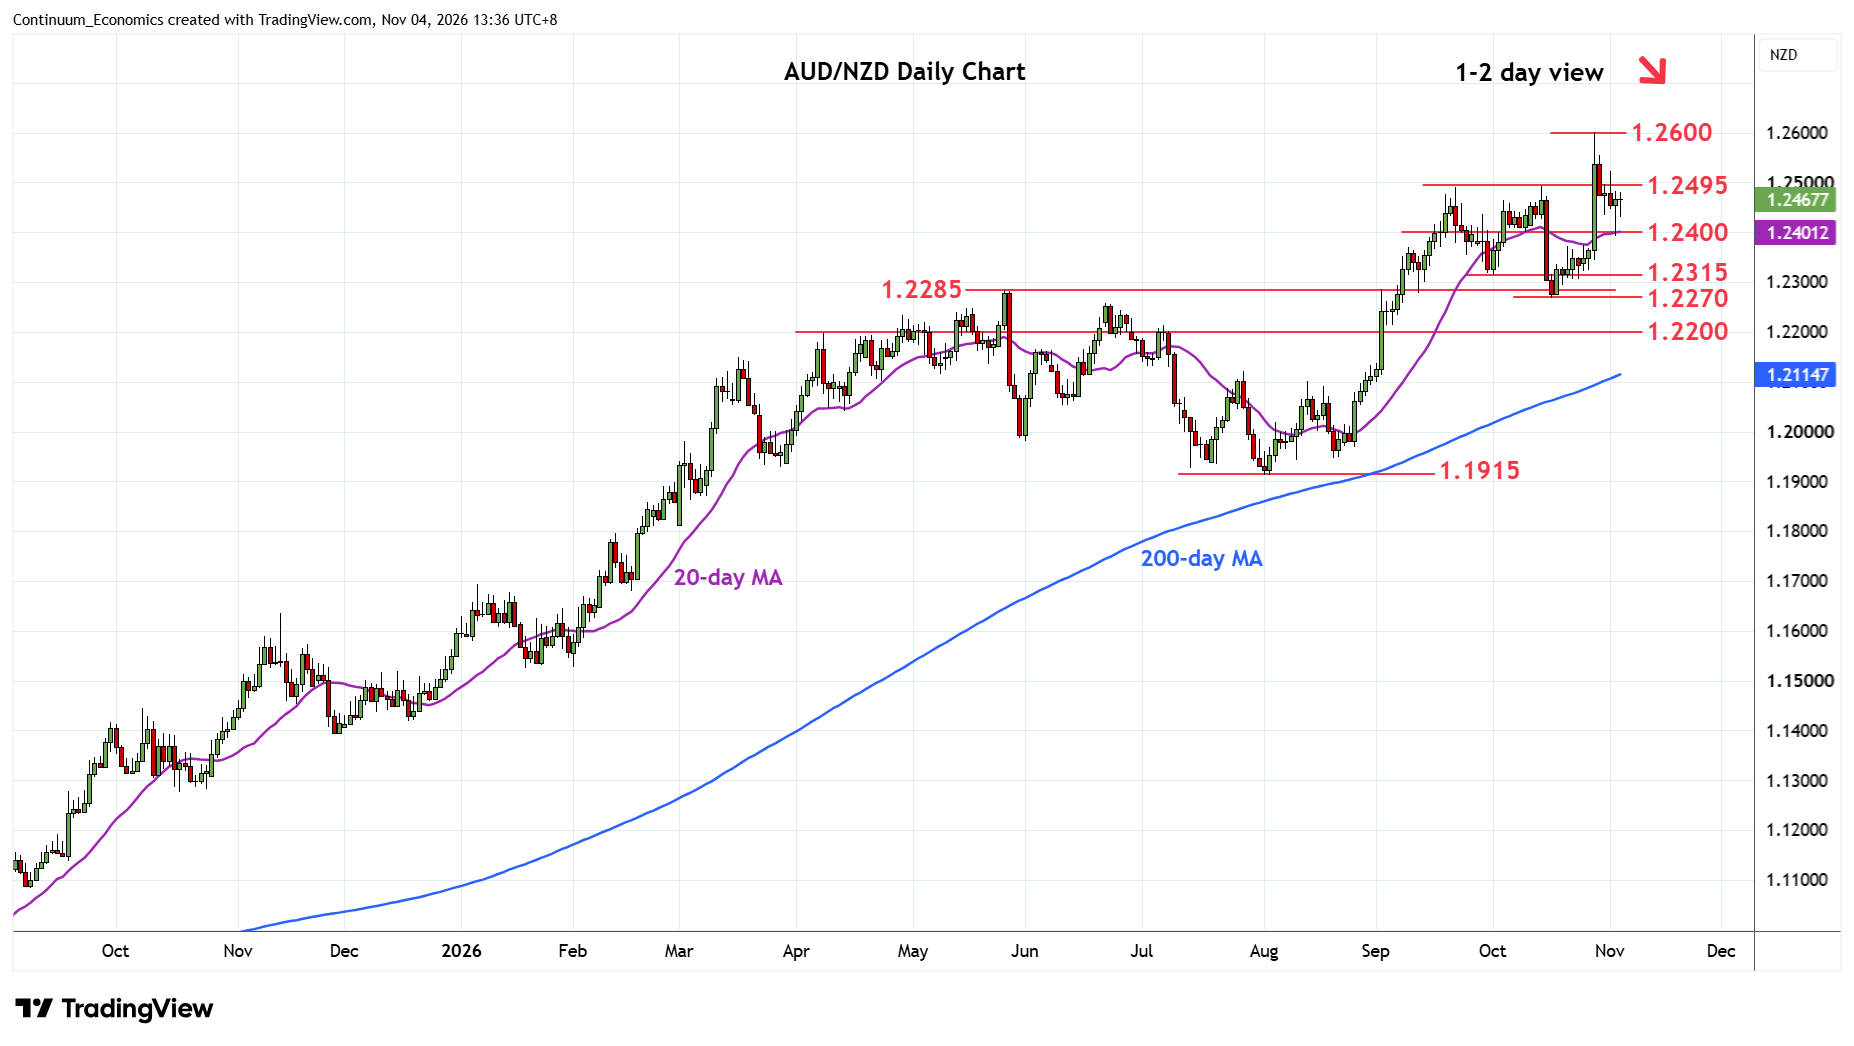
Remains in consolidation below the 1.2500 level following pullback from the 1.2600, 28 October current year high
| Level | Comment | Level | Comment | |||||
|---|---|---|---|---|---|---|---|---|
| R4 | 1.2682 | ** | Mar 2013 year high | S1 | 1.2400 | * | congestion | |
| R3 | 1.2650 | * | congestion | S2 | 1.2340 | * | 38.2% Aug/Oct rally | |
| R2 | 1.2600 | ** | 28 Oct YTD high | S3 | 1.2315 | * | 1 Oct low | |
| R1 | 1.2495 | * | 14 Oct high | S4 | 1.2270 | ** | 16 Oct low |
Asterisk denotes strength of level
06:00 GMT - Remains in consolidation below the 1.2500 level following pullback from the 1.2600, 28 October current year high. Daily and weekly studies have turned lower to unwind overbought readings and threatens break of the 1.2400 support. Below here will see room for deeper pullback to retrace gains from the 1.1915 August low towards 1.2340, 38.2% Fibonacci retracement. Lower still, will return focus to the 1.2315 and 1.2270 lows. Meanwhile, resistance is lowered to 1.2495 October high which is expected to cap and sustain losses from the 1.2600 high.