Published: 2026-08-03T07:33:19.000Z
Chart GBP/USD Update: Consolidating test of 1.3500 - daily studies rising
3
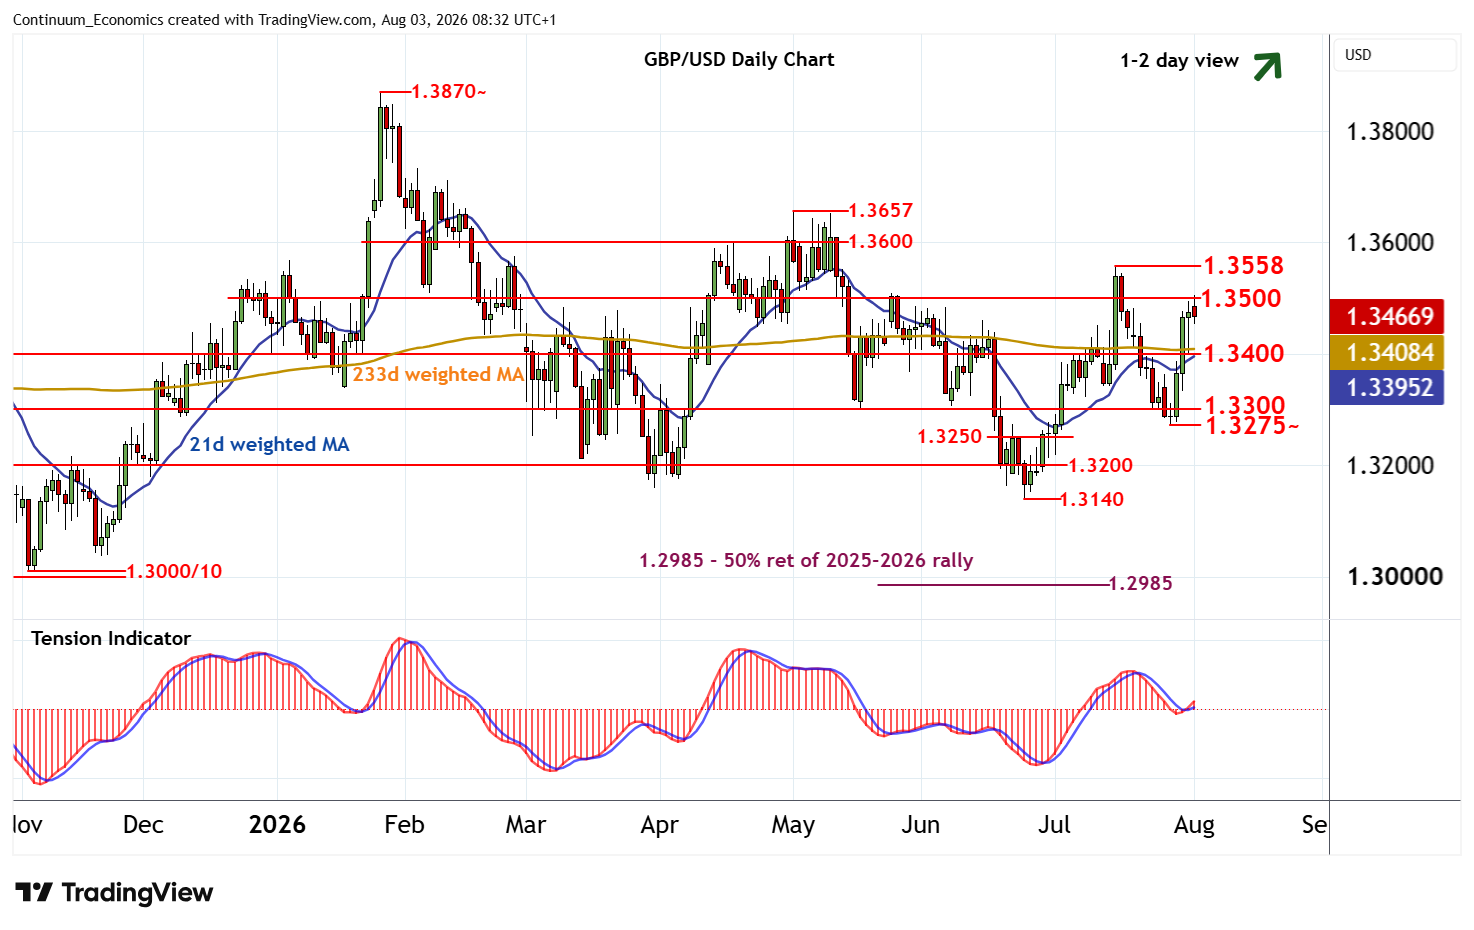
Choppy trade has given way to the anticipated test of congestion resistance at 1.3500
| Level | Comment | Level | Comment | |||||
|---|---|---|---|---|---|---|---|---|
| R4 | 1.3657 | ** | 1 May (m) high | S1 | 1.3400 | ** | congestion | |
| R3 | 1.3600 | ** | congestion | S2 | 1.3300 | ** | congestion | |
| R2 | 1.3558 | ** | 15 Jul (m) high | S3 | 1.3275~ | * | 28 Jul low | |
| R1 | 1.3500 | * | congestion | S4 | 1.3250 | intraday break level |
Asterisk denotes strength of level
08:10 BST - Choppy trade has given way to the anticipated test of congestion resistance at 1.3500, where unwinding overbought intraday studies are prompting a short-term pullback. Daily stochastics and the daily Tension Indicator continue to rise, pointing to room for a break above here. But rising weekly stochastics are flattening, suggesting immediate scope should be limited in consolidation beneath the 1.3558 monthly high of 15 July, before the positive weekly Tension Indicator prompts further gains. Meanwhile, support remains at congestion around 1.3400 and should underpin any immediate setbacks.