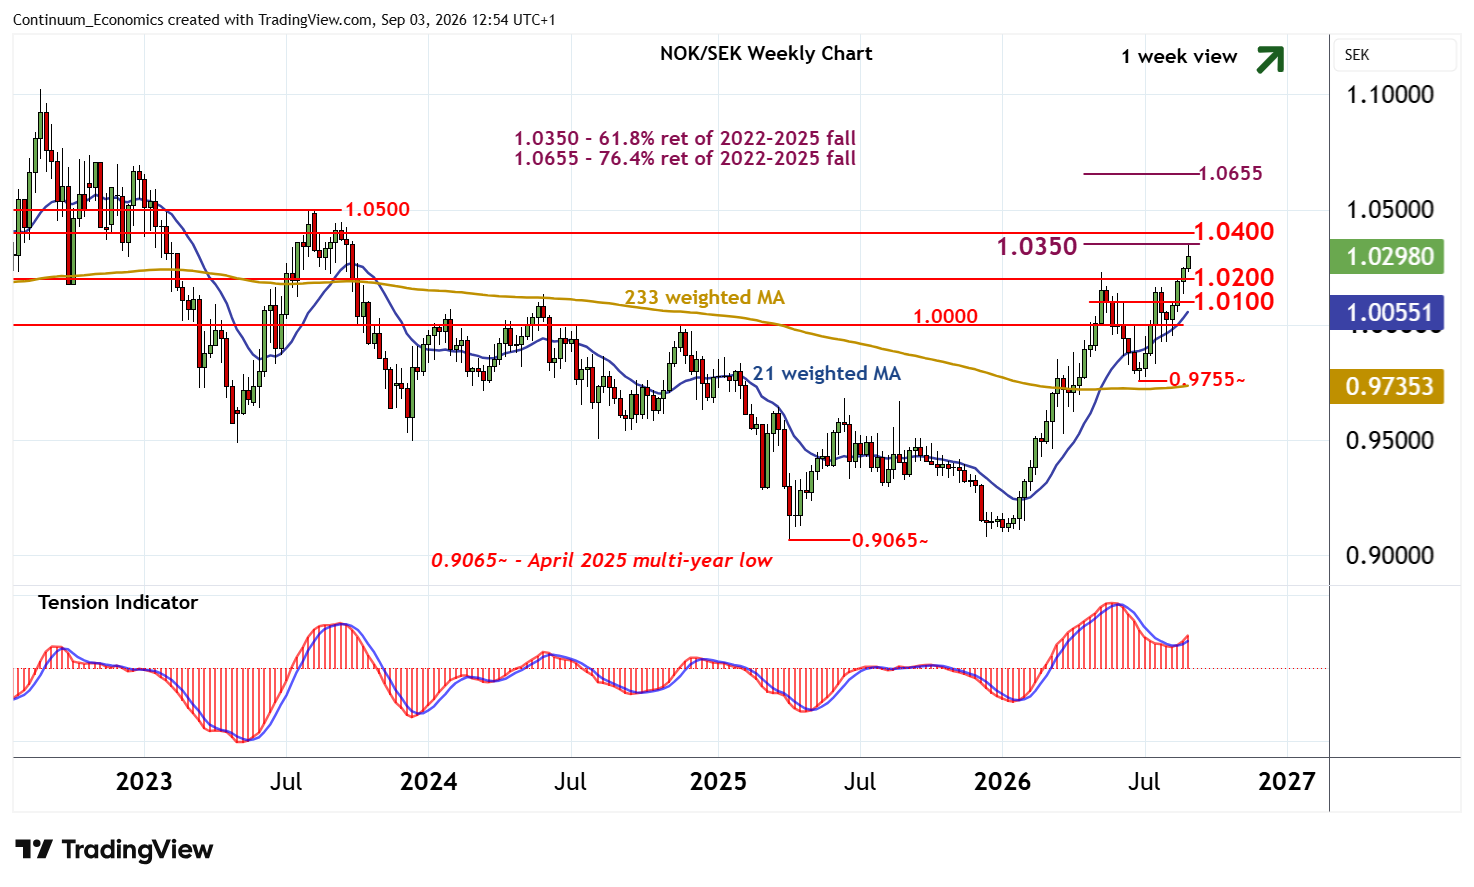
Chart NOK/SEK Update: Reached Fibonacci resistance - background studies continue to rise
Cautious trade around 1.0200 has given way to the anticipated break
| Levels | Imp | Comment | Levels | Imp | Comment | |||
|---|---|---|---|---|---|---|---|---|
| R4 | 1.0600 | * | historic congestion | S1 | 1.0200 | * | congestion | |
| R3 | 1.0500 | * | congestion, break level | S2 | 1.0100 | * | congestion | |
| R2 | 1.0400 | * | historic congestion | S3 | 1.0050 | * | congestion tops | |
| R1 | 1.0350 | ** | 61.8% ret of 2022-2025 fall | S4 | 1.0000 | * | parity, congestion |
Asterisk denotes strength of level
12:20 BST - Cautious trade around 1.0200 has given way to the anticipated break, with gains from the 0.9066~ multi-year low of April 2025 posting fresh 2026 year highs at the 1.0350 Fibonacci retracement. Overbought daily stochastics are unwinding, suggesting room for a pullback in the coming sessions back to 1.0200. But the positive daily Tension Indicator and rising weekly charts should limit any break in renewed buying interest/consolidation above further congestion around 1.0100.
Following cautious/corrective trade, fresh gains are looked for. A later close above 1.0350 will help to improve sentiment and open up a test of congestion around 1.0400. Beyond here is 1.0500.