Published: 2026-06-09T01:43:13.000Z
Chart GBP/USD Update: Consolidating above 1.3300
2
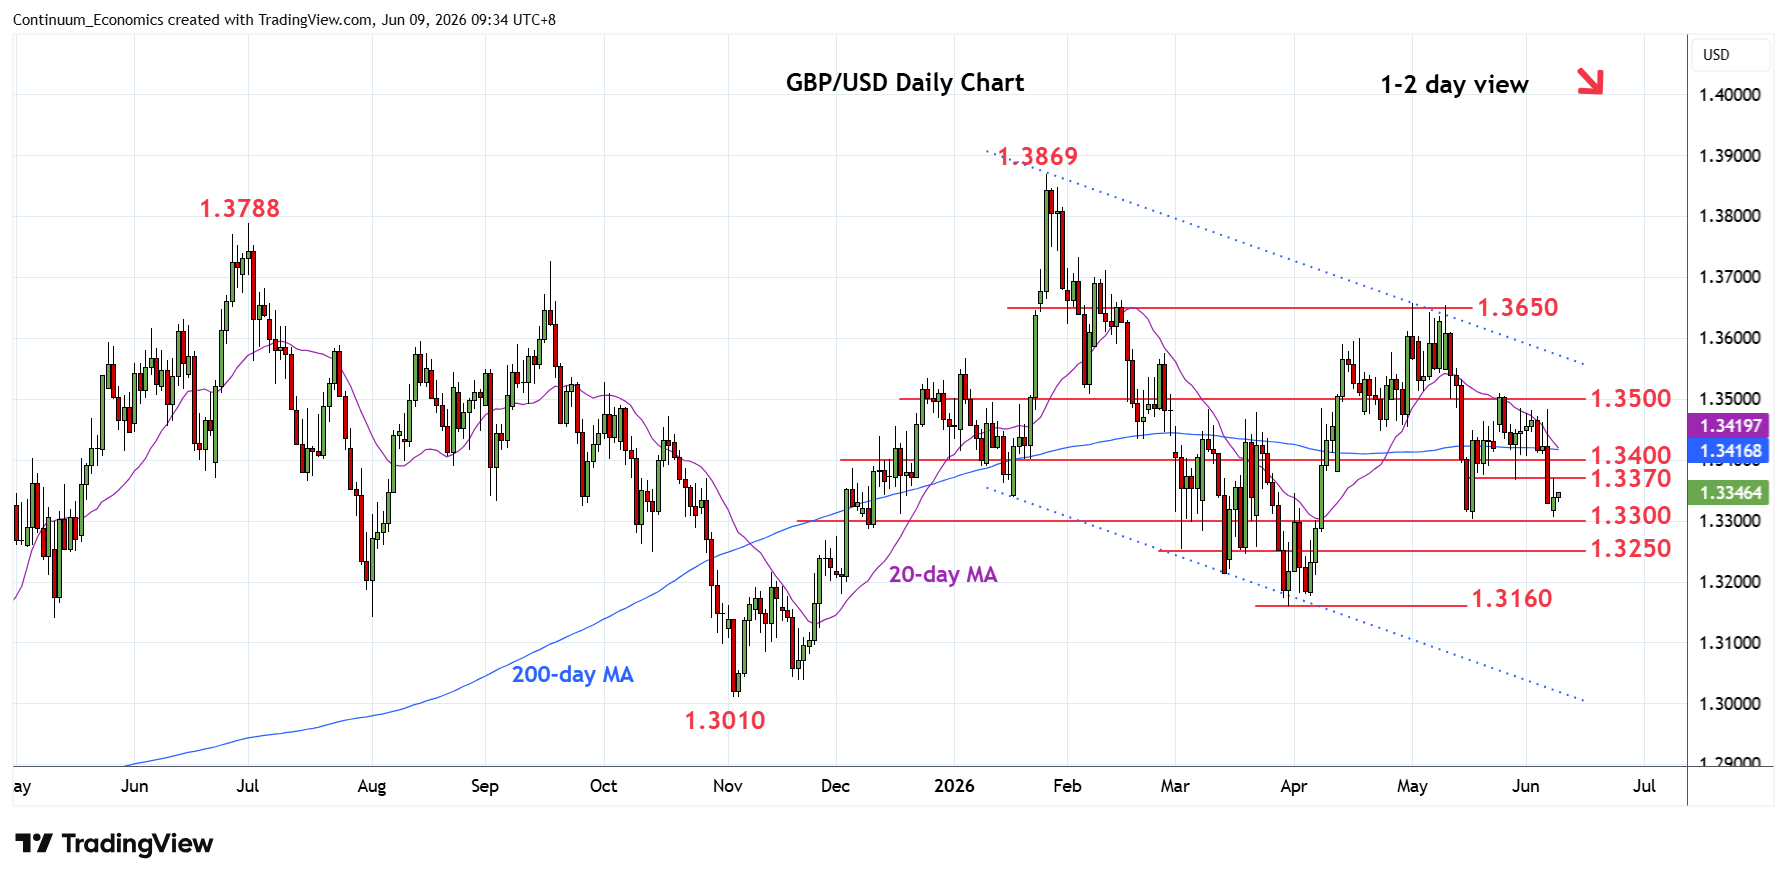
Steadied at 1.3305 low as prices consolidate losses from resistance at the 1.3485/1.3500 area
| Level | Comment | Level | Comment | |||||
|---|---|---|---|---|---|---|---|---|
| R4 | 1.3485/00 | ** | 29 May high, congestion | S1 | 1.3300 | ** | May low, congestion | |
| R3 | 1.3415 | * | congestion, 200-day MA | S2 | 1.3250 | * | congestion | |
| R2 | 1.3400 | * | congestion | S3 | 1.3200 | * | congestion | |
| R1 | 1.3370 | * | 28 May low | S4 | 1.3160 | ** | 31 Mar YTD low |
Asterisk denotes strength of level
01:40 GMT - Steadied at 1.3305 low as prices consolidate losses from resistance at the 1.3485/1.3500 area. However, pressure remains on the downside and consolidation is expected to give way to renewed selling pressure later. Break of the 1.3300 level will extend the broader losses from the 1.3650 May swing high/channel resistance and see room to 1.3250 congestion. Below this will see potential for retest of 1.3200 level then the 1.3160 March current year low. Meanwhile, resistance starts at 1.3370 and this extend to 1.3400/15 congestion area which are expected to cap.