Published: 2026-06-12T00:34:23.000Z
Chart AUD/USD Update: Limited on break of .7000 figure
1
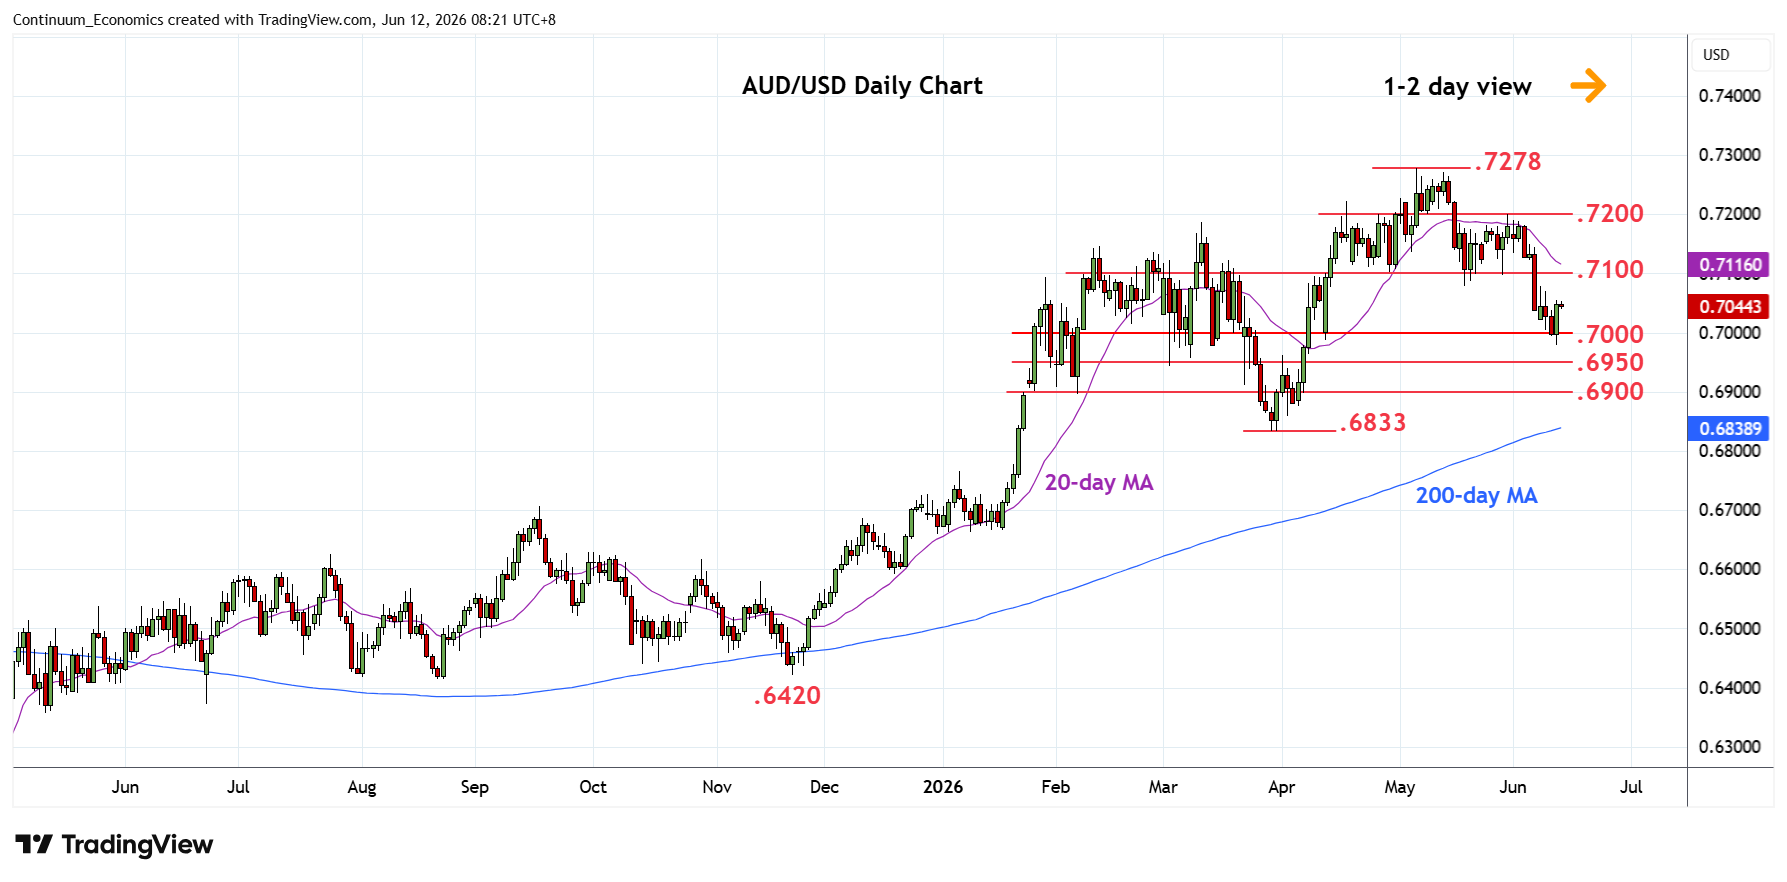
Limited on break of the .7000 figure and bounce from the .6980 low see prices unwinding oversold daily studies
| Levels | Imp | Comment | Levels | Imp | Comment | |||
|---|---|---|---|---|---|---|---|---|
| R4 | 0.7200 | ** | 29 May high, congestion | S1 | 0.7000 | * | congestion | |
| R3 | 0.7150 | * | congestion | S2 | 0.6980 | ** | 11 Jun low | |
| R2 | 0.7100 | ** | congestion | S3 | 0.6950 | * | congestion | |
| R1 | 0.7080 | * | May low | S4 | 0.6900 | * | congestion |
Asterisk denotes strength of level
00:30 GMT - Limited on break of the .7000 figure and bounce from the .6980 low see prices unwinding oversold daily studies. The resulting outside range suggest scope for bounce to retrace losses from the .7200 late-May high towards strong resistance at the .7080/.7100 area. Would take break here to fade the downside pressure and see room for stronger recovery to resistance at .7150/.7200 congestion area. Meanwhile, support at the .7000/.6980 area now underpin. Would take break here to open up room towards support at the .6950/.6900 congestion area.