Chart USD Index DXY Update: Turning higher
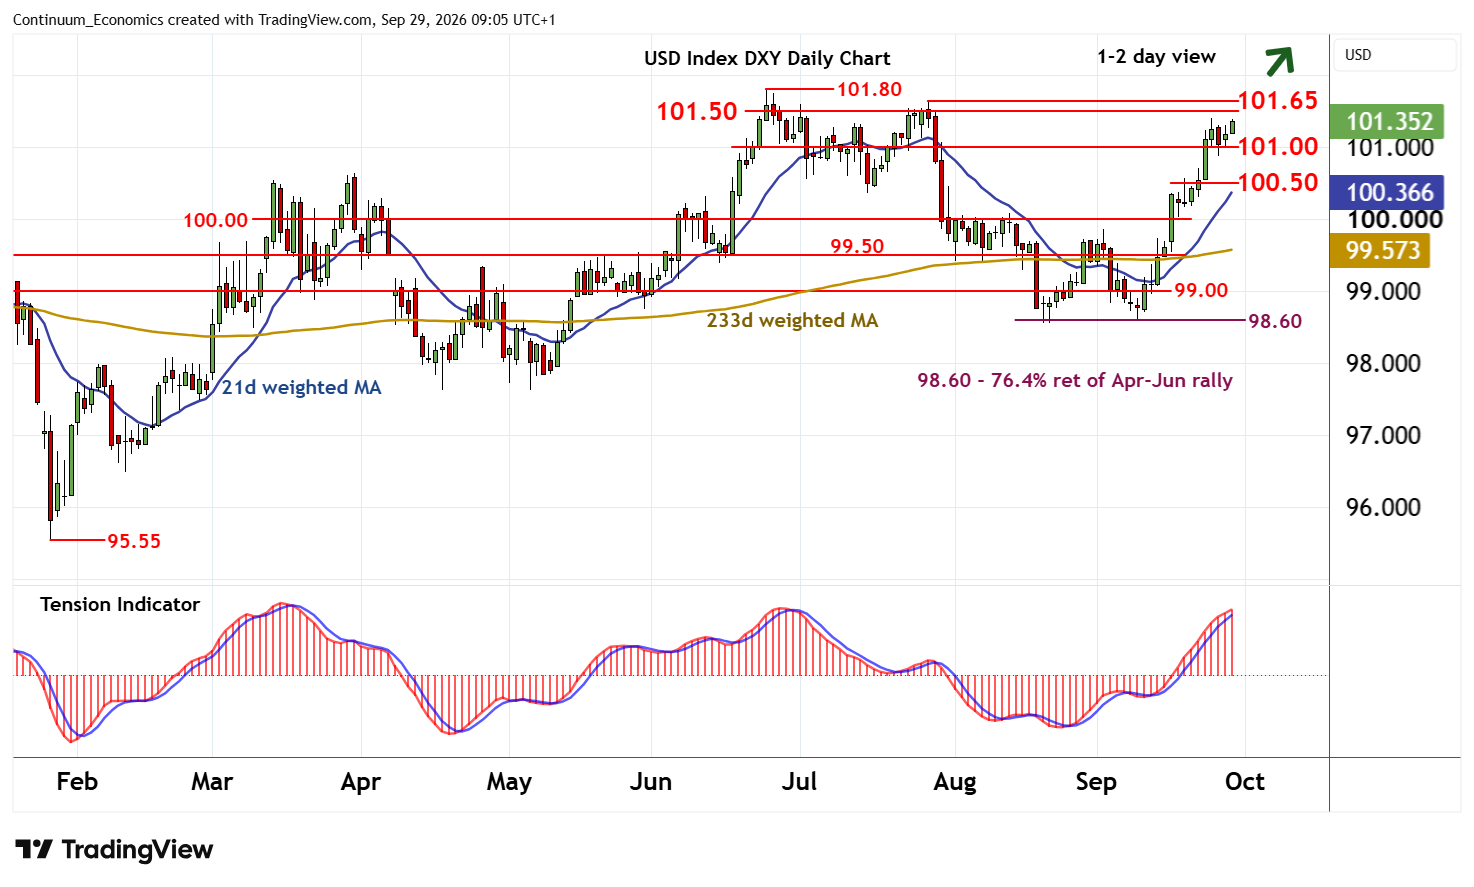
Choppy trade above congestion support at 101.00 is giving way to a drift higher
| Levels | Imp | Comment | Levels | Imp | Comment | |||
|---|---|---|---|---|---|---|---|---|
| R4 | 102.00 | ** | congestion | S1 | 101.00 | ** | congestion | |
| R3 | 101.80 | ** | 24 Jun YTD high | S2 | 100.50 | break level | ||
| R2 | 101.65 | ** | 28 Jul (m) high | S3 | 100.00 | ** | congestion | |
| R1 | 101.50 | * | range highs | S4 | 99.50 | * | congestion |
Asterisk denotes strength of level
08:55 BST - Choppy trade above congestion support at 101.00 is giving way to a drift higher, as intraday studies improve, with focus turning back to resistance at the 101.50 range highs and the 101.65 monthly high of 28 July. Any immediate tests could give way to consolidation, as overbought daily stochastics turn down, before the positive daily Tension Indicator and improving weekly charts open up a test of critical resistance at the 101.80 current year high of 24 June. A further close above here will improve sentiment and confirm continuation of broader January gains beyond congestion around 102.00.
Meanwhile, a close below 101.00, if seen, will help to stabilise price action and give way to fresh consolidation above 100.50.