Chart GBP/USD Update: Higher in range - daily studies rising
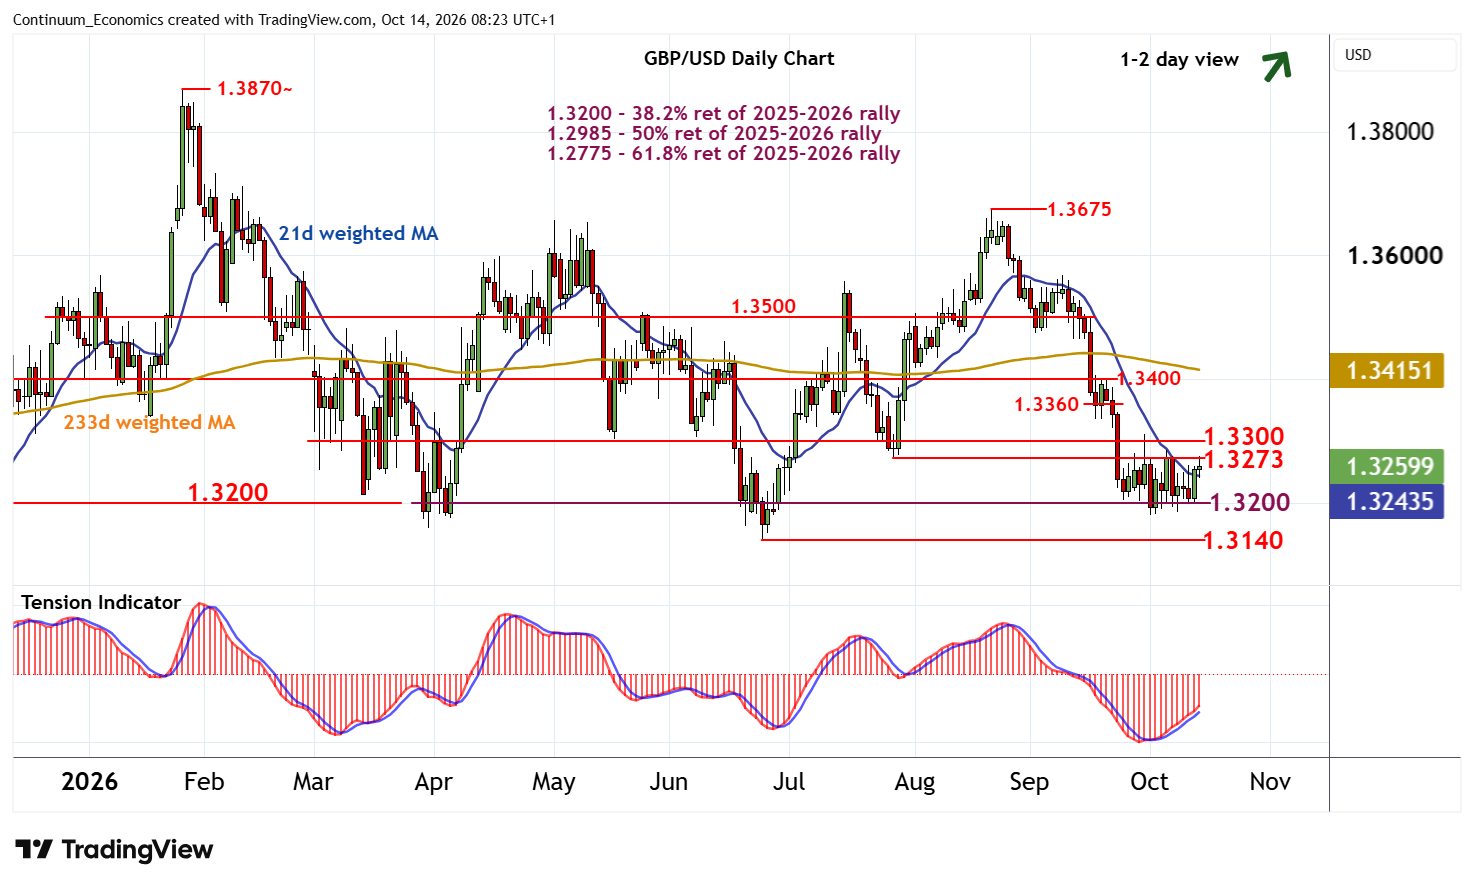
The anticipated minor test higher has reached resistance at the 1.3273 weekly low of 28 July
| Level | Comment | Level | Comment | |||||
|---|---|---|---|---|---|---|---|---|
| R4 | 1.3400 | ** | congestion | S1 | 1.3200 | ** | cong, 38.2% ret | |
| R3 | 1.3360 | * | range lows | S2 | 1.3140 | ** | 24 Jun YTD low | |
| R2 | 1.3300 | ** | congestion | S3 | 1.3100 | ** | congestion | |
| R1 | 1.3273 | ** | 28 Jul (w) low | S4 | 1.3000/10 | ** | cong; November 2025 low |
Asterisk denotes strength of level
08:10 BST - The anticipated minor test higher has reached resistance at the 1.3273 weekly low of 28 July, where unwinding overbought intraday studies are prompting a minor pullback. Daily stochastics and the daily Tension Indicator continue to rise, however, pointing to room for a later break to congestion around 1.3300. Continuation beyond here will improve sentiment and open up the 1.3360 range lows. But negative weekly charts should limit any initial tests in fresh consolidation.
Meanwhile, immediate support is at congestion around 1.3250. But stronger support at 1.3200 should underpin any deeper setbacks. A close beneath here, not yet seen, will add weight to sentiment and extend late-August losses towards strong support at the 1.3140 current year low of 24 June.