Chart EUR/USD Update: Consolidating test of support - background under pressure
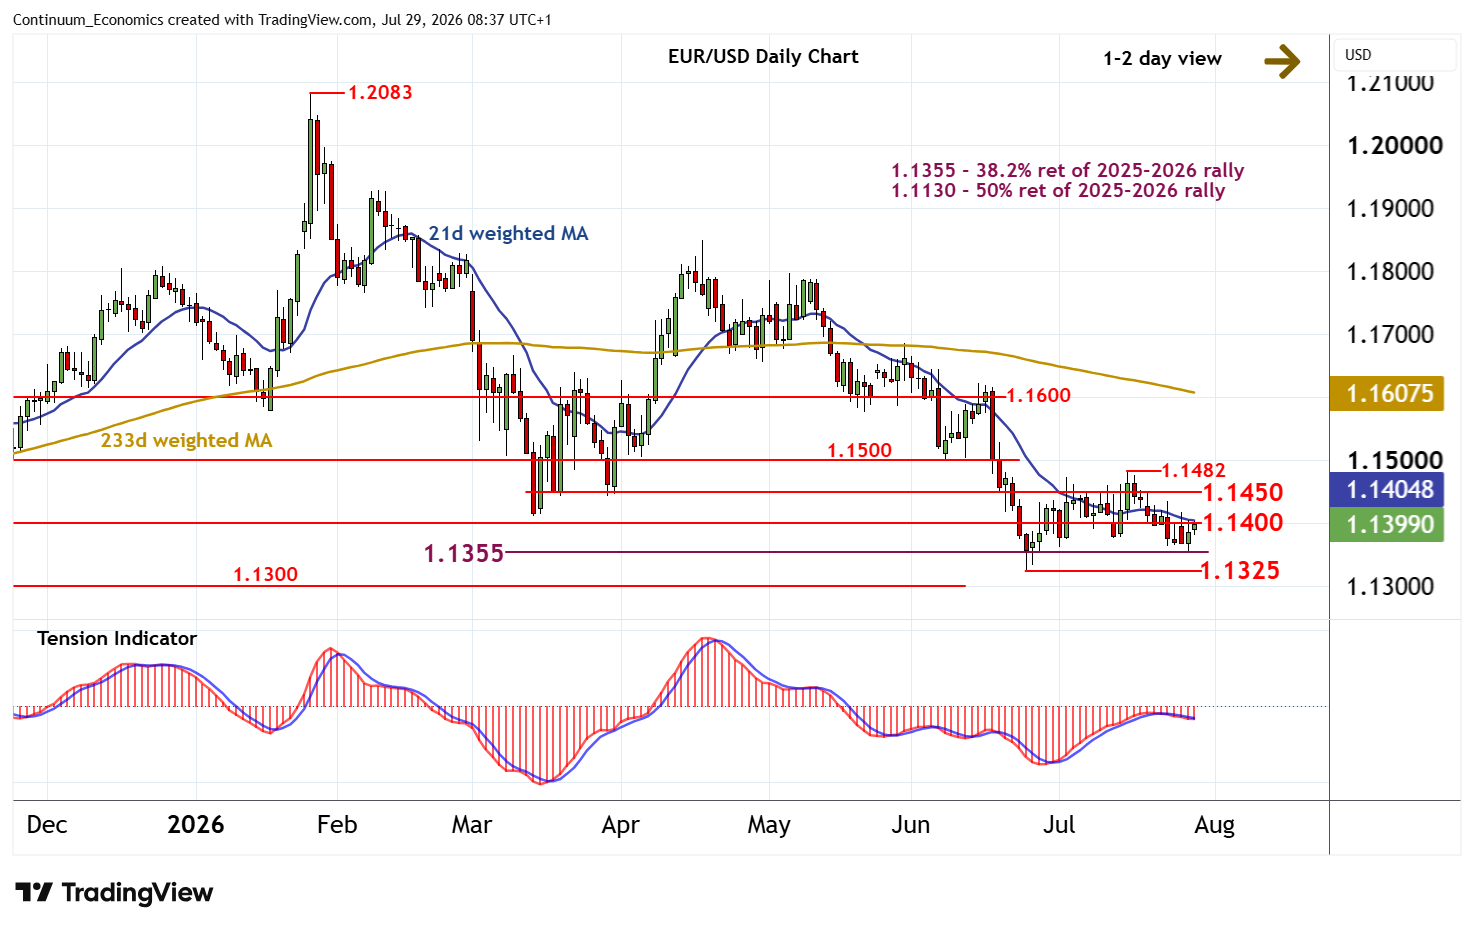
The test of support at the 1.1355 Fibonacci retracement has given way to a bounce
| Levels | Imp | Comment | Levels | Imp | Comment | |||
|---|---|---|---|---|---|---|---|---|
| R4 | 1.1500 | ** | congestion | S1 | 1.1355 | ** | 38.2% ret of 2025-2026 rally | |
| R3 | 1.1482 | ** | 15 Jul (w) high | S2 | 1.1325 | ** | 24 Jun YTD low | |
| R2 | 1.1450 | * | congestion | S3 | 1.1300 | ** | congestion | |
| R1 | 1.1400 | * | congestion | S4 | 1.1275 | * | July 2023 (y) high |
*Asterisk denotes strength of level
08:30 BST - The test of support at the 1.1355 Fibonacci retracement has given way to a bounce, as intraday studies turn higher, with prices currently pressuring congestion resistance at 1.1400. Daily stochastics are also ticking higher, suggesting room for a test above here. But the bearish daily Tension Indicator and deteriorating weekly charts should limit scope in renewed selling interest/consolidation beneath further congestion around 1.1450. Following cautious/corrective trade, fresh losses are looked for. Support remains at 1.1355. But a close below the 1.1325 current year low of 24 June will turn sentiment negative and confirm continuation of January losses.