Weekly Chart USD Index DXY: Balanced beneath fresh year highs - background studies remain positive
Consolidation around congestion support at 100.00 has given way to fresh year highs
Consolidation around congestion support at 100.00 has given way to fresh year highs,
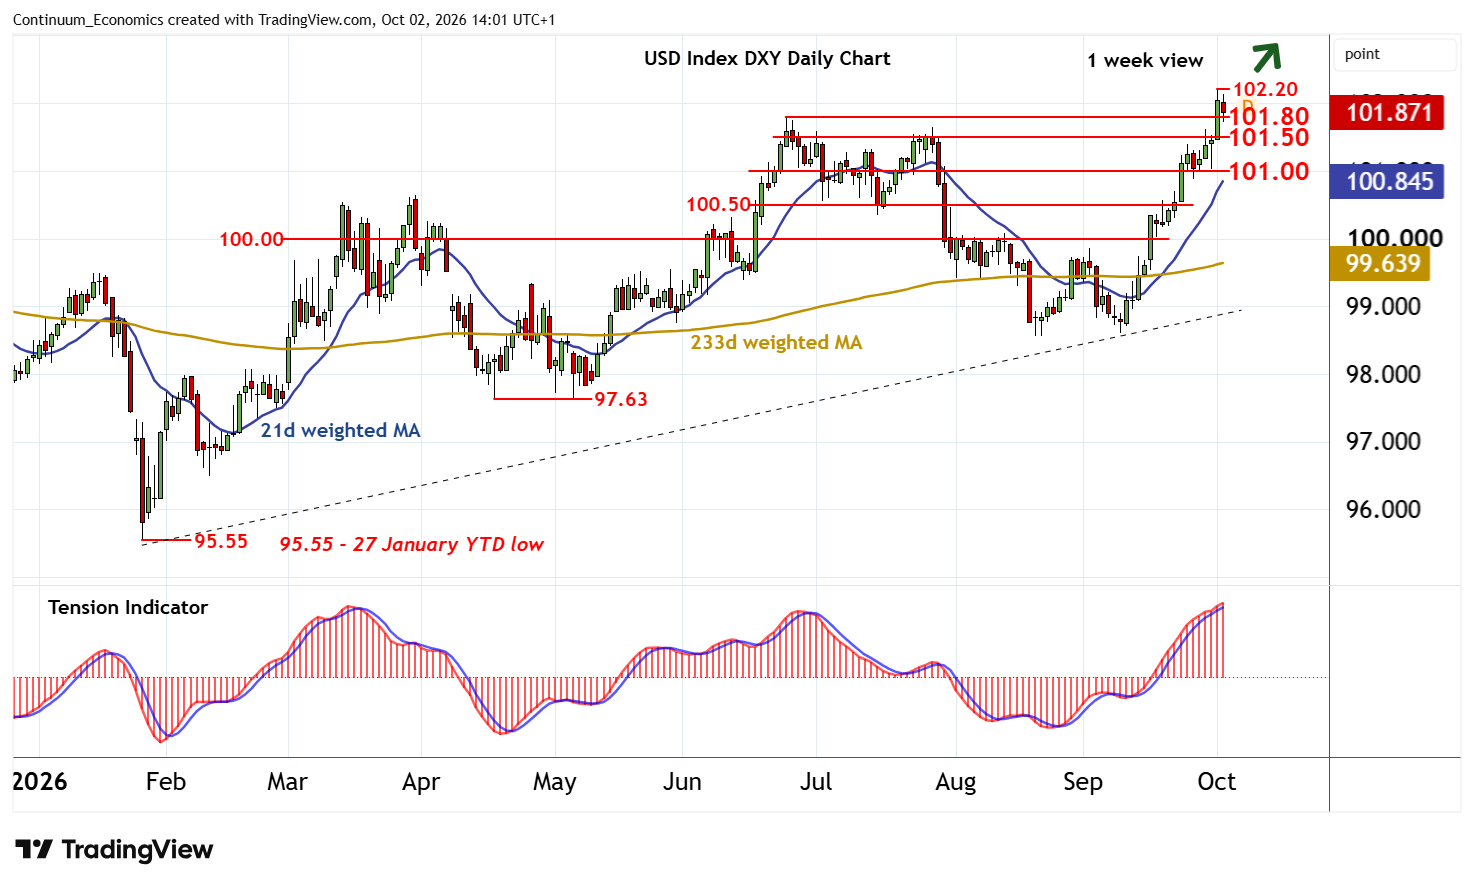
with gains from the 95.55 current year low of 27 January reaching 102.20 before settling back, as overbought daily stochastics unwind.
Immediate focus is on support within congestion around 101.50 and the 101.80 monthly high of 24 June. A test beneath here cannot be ruled out. But the positive daily Tension Indicator and rising weekly charts should limit scope in renewed buying interest/consolidation within congestion above 101.00. A further break, if seen, will add weight to sentiment and signal a deeper retracement, as the 101.50 break level then attracts.
Following cautious/corrective trade, fresh gains are looked for.
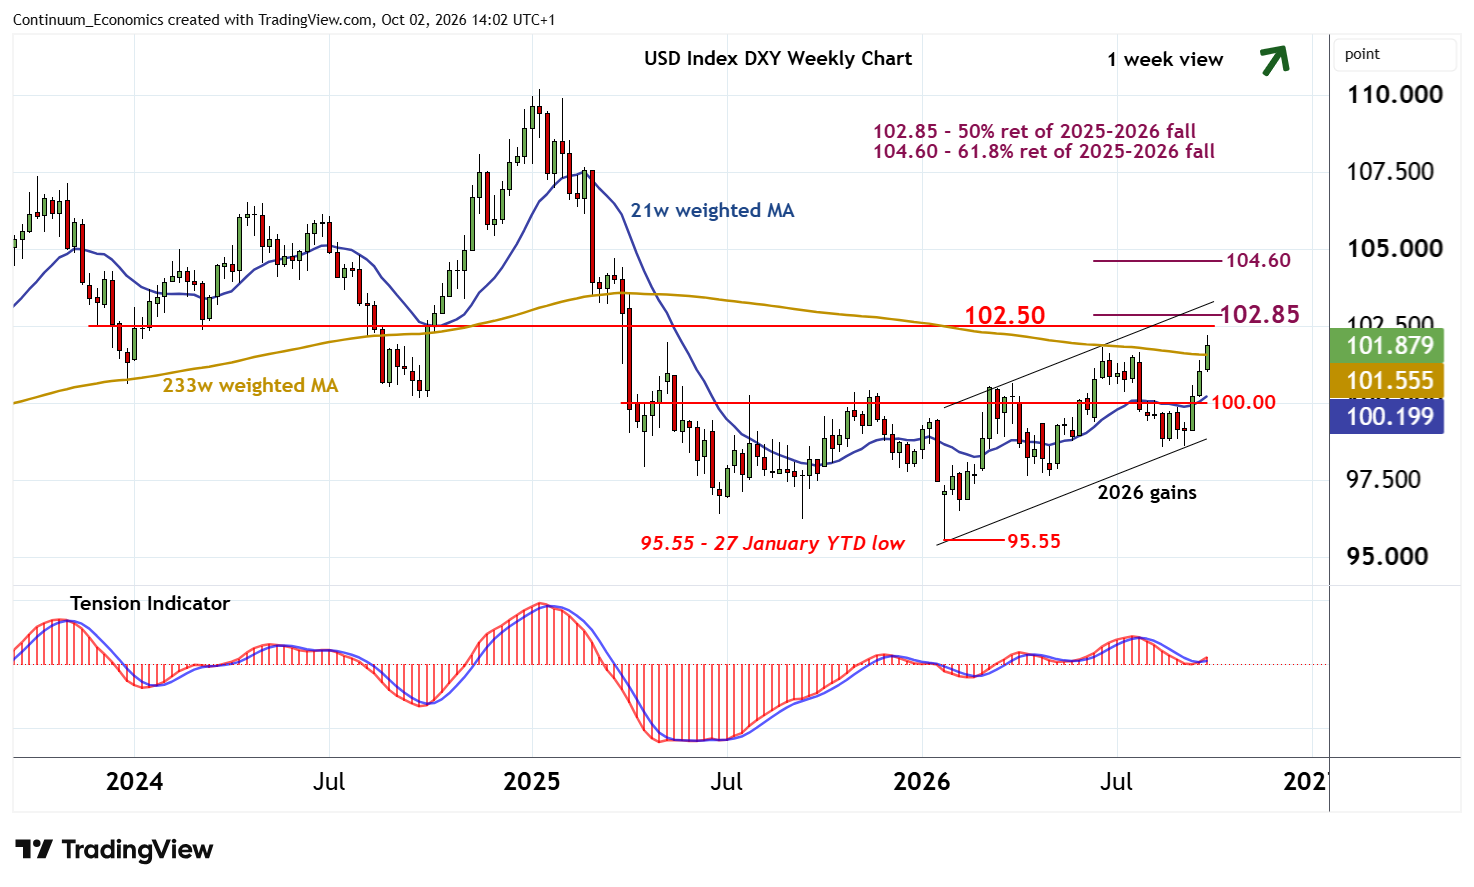
A later close above the 102.20 current year high of 1 October will turn sentiment positive once again and extend January gains towards strong resistance at the 102.85 Fibonacci retracement. However, mixed longer-term charts could limit any initial tests in profit-taking/consolidation, before January gains resume.