Monthly U.S. Chart S&P 500: Extend underlying bull trend
Choppy trade below the June all-time high at 7620 saw prices tracing out 2-month triangle pattern before giving way to break to extend the underlying bull trend
Choppy trade below the June all-time high at 7620 saw prices tracing out 2-month triangle pattern before giving way to break to extend the underlying bull trend.
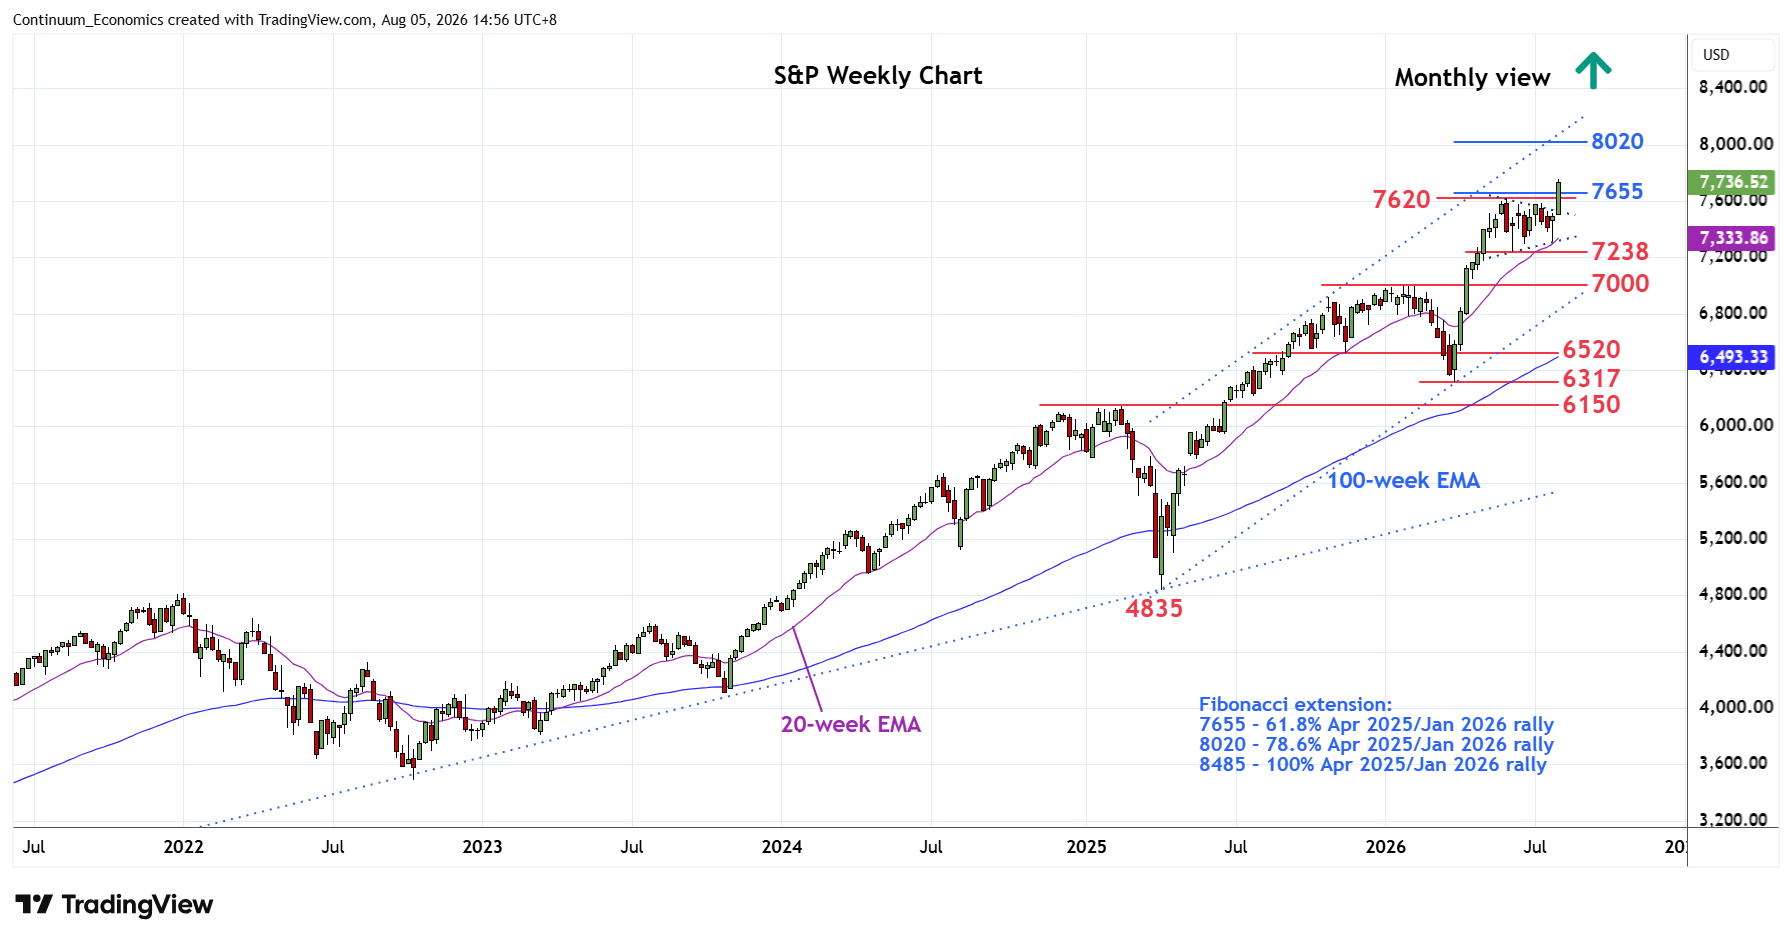
Break above 7620 June high and the nearby Fibonacci projection target at 7655 see further gains within the bullish channel from the April 2025 year low to reach fresh high at 7758. Positive daily and weekly studies keep focus firmly on the upside and higher will see potential to the 8000 figure then the 8020, Fibonacci projection target. Gains beyond this, if seen, will see room to 8485, equality projection of the April 2025/January 2026 rally.
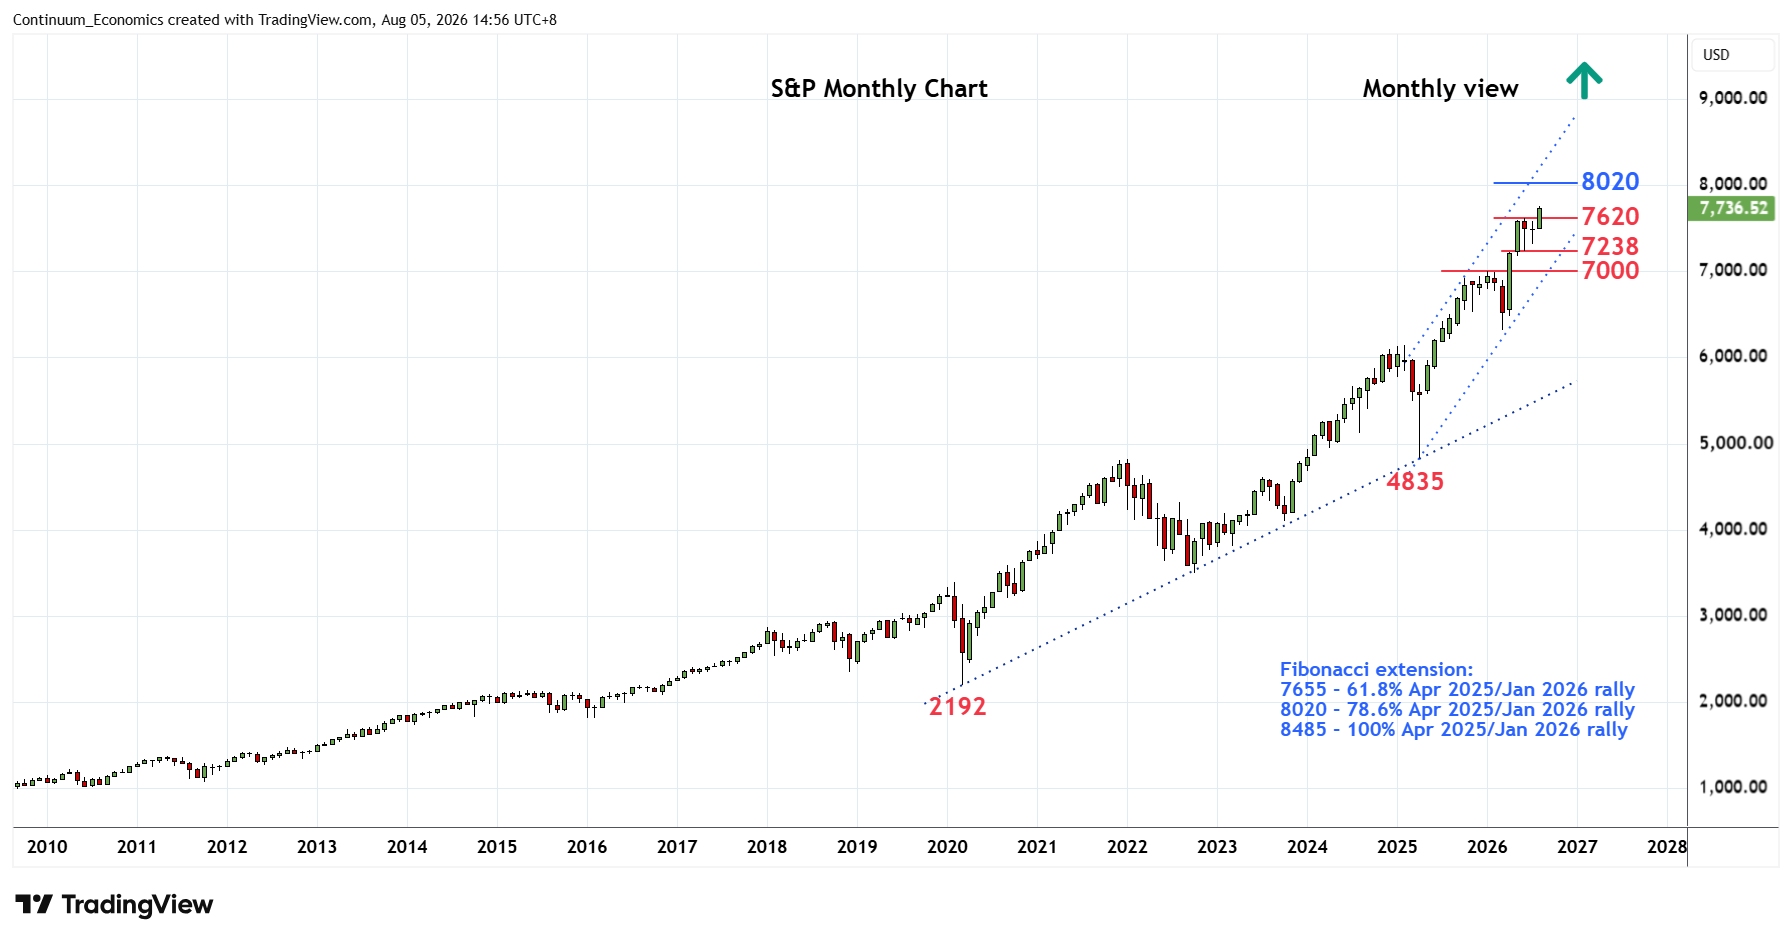
Meanwhile, support is raised to the 7300/7238 June lows which should underpin. Below here will put bulls on hold and open up room for consolidation to the 7000, late-January high which is expected to limit corrective pullback. Break here needed to turn focus lower to correct strong gains from the April 2025 year low to the 6500 congestion and strong support at 6150/6100, the January 2025 and 2024 year highs.