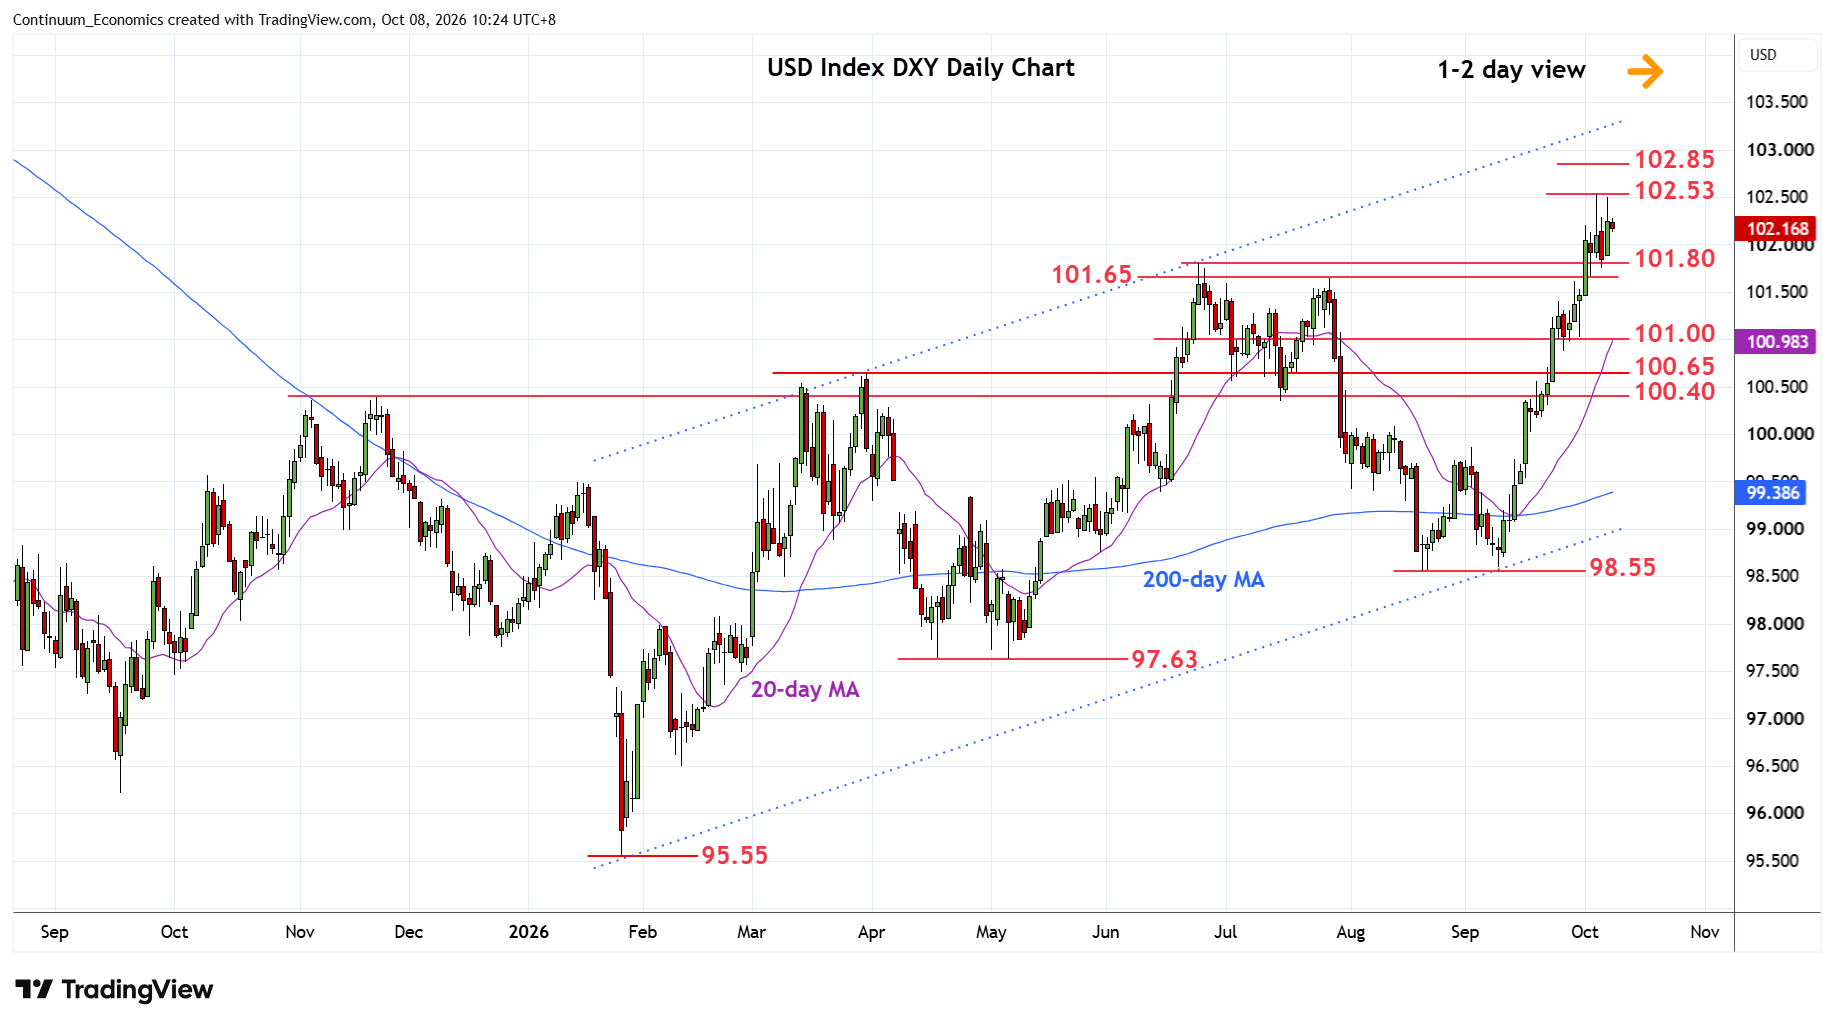
Chart USD Index DXY Update: Holds firm above 101.80/101.65 support
Back to pressure the upside following bounce from support at the 101.80/101.65, June/July highs
| Levels | Imp | Comment | Levels | Imp | Comment | |||
|---|---|---|---|---|---|---|---|---|
| R4 | 103.20 | ** | Mar 2025 low | S1 | 101.80 | ** | Jun high | |
| R3 | 103.00 | * | congestion | S2 | 101.65 | * | Jul high | |
| R2 | 102.85 | * | 50% 2025/2026 fall | S3 | 101.00 | * | congestion | |
| R1 | 102.53 | ** | 5 Oct YTD high | S4 | 100.65 | ** | Mar high |
Asterisk denotes strength of level
02:30 GMT - Back to pressure the upside following bounce from support at the 101.80/101.65, June/July highs. However, daily studies have turned down from overbought areas and suggest the 102.53 high expected to cap. Clearance, if seen, will open up room for extension towards 50% Fibonacci retracement at 102.85 then the resistance at 103.20 low of March 2025. Meanwhile, support at the 101.80/101.65 area underpin. Would take break here to open up room for deeper pullback to retrace strong gains from the 98.60/98.55, September/August lows. Lower will see room to the 101.00 level then the strong support at the 100.65/100.40, March high and November 2025 high.