Chart AUD/NZD Update: Extending losses
Break of the 1.2230 low of last week and descending triangle see prices extending losses from the 1.2600, October current year high
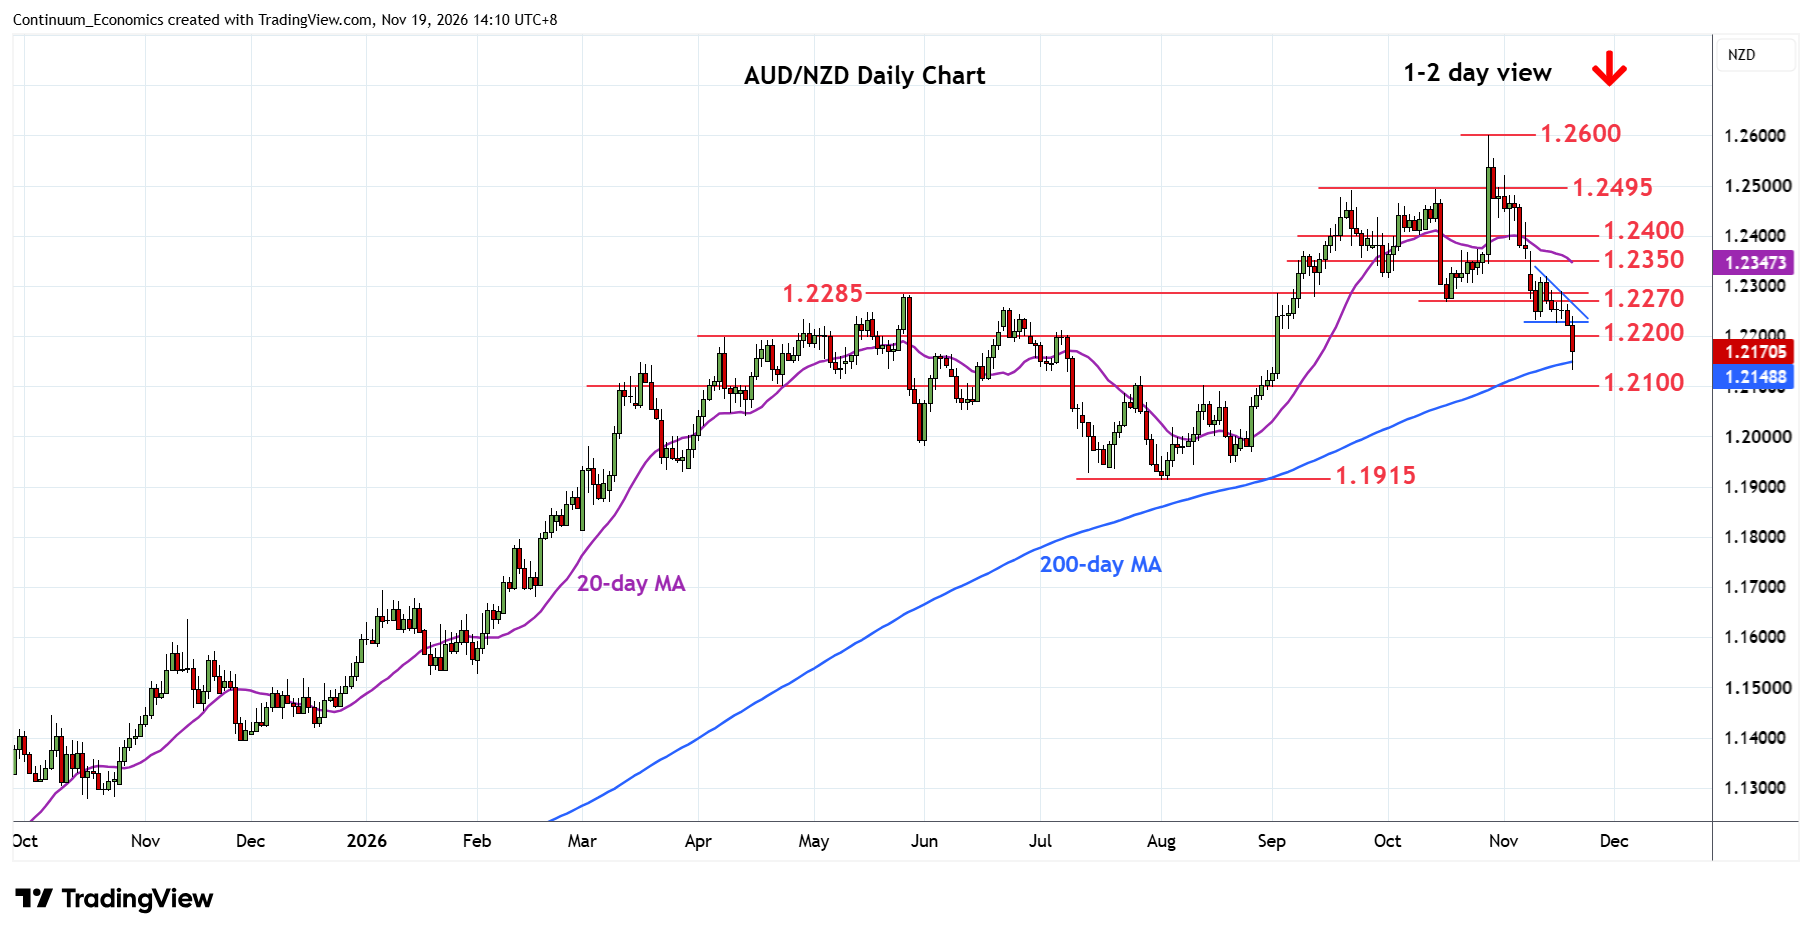
| Level | Comment | Level | Comment | |||||
|---|---|---|---|---|---|---|---|---|
| R4 | 1.2400 | * | congestion | S1 | 1.2150 | * | congestion, 200-day MA | |
| R3 | 1.2350 | * | congestion | S2 | 1.2100 | ** | congestion, Aug high | |
| R2 | 1.2285/00 | ** | May high, congestion | S3 | 1.2050 | * | congestion | |
| R1 | 1.2230/70 | * | 10 Nov, Oct lows | S4 | 1.2000 | * | figure, congestion |
Asterisk denotes strength of level
06:20 GMT - Break of the 1.2230 low of last week and descending triangle pattern see prices extending losses from the 1.2600, October current year high. Follow-through to break the 1.2200 level see further retracement of the August/October rally to reach strong support at the 1.2150/00 congestion and August high. Below the latter will turn focus to the 1.2000 figure and 1.1915 August low. Meanwhile, resistance is lowered to the 1.2230/70 previous lows which should cap corrective bounce. Above here and the 1.2300 level will fade the downside pressure and see room for stronger gains to retrace losses from October high.