Published: 2026-10-09T06:38:44.000Z
Chart USD/CAD Update: Leaning lower from 1.4290 high
1
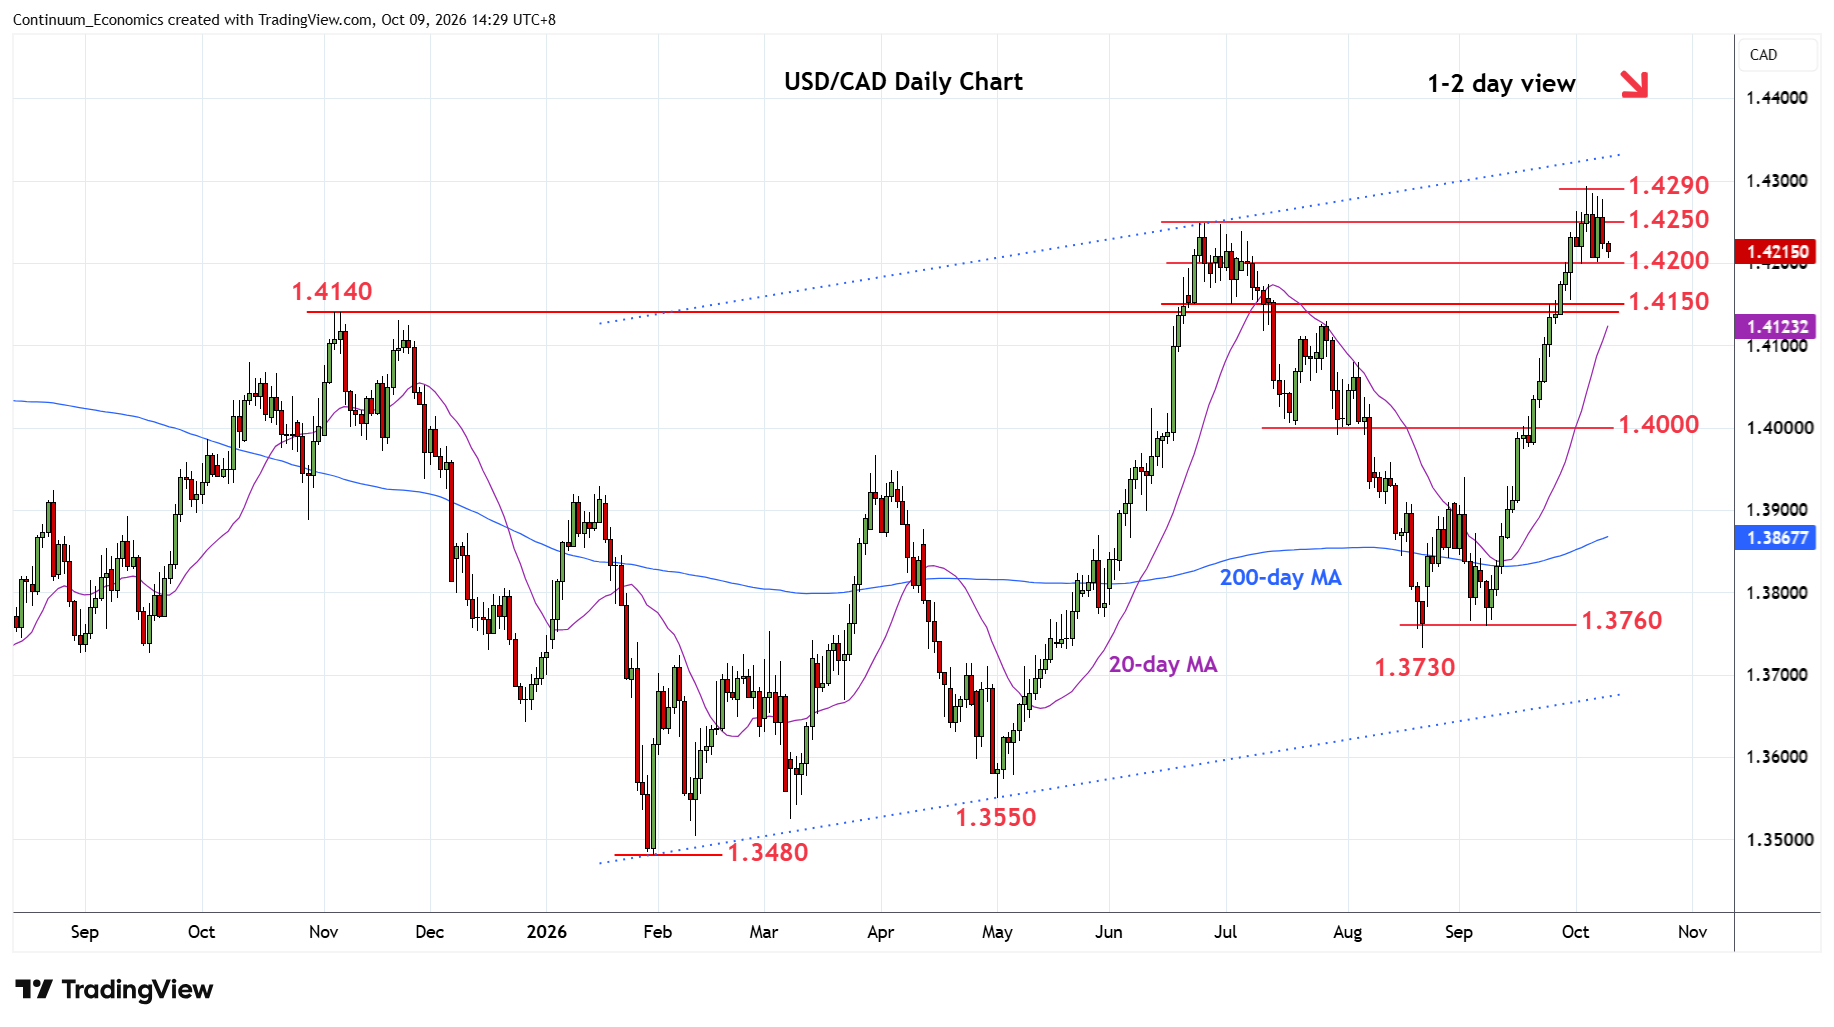
Leaning lower from the 1.4290 high and 61.8% Fibonacci level towards support at the 1.4200 level
| Levels | Imp | Comment | Levels | Imp | Comment | |||
|---|---|---|---|---|---|---|---|---|
| R4 | 1.4400 | * | congestion | S1 | 1.4200 | * | congestion | |
| R3 | 1.4350 | * | congestion | S2 | 1.4150 | * | congestion | |
| R2 | 1.4330 | * | channel | S3 | 1.4140 | ** | Nov 2025 high | |
| R1 | 1.4290 | * | 61.8% 2025/2026 fall | S4 | 1.4100 | * | congestion |
Asterisk denotes strength of level
06:40 GMT - Leaning lower from the 1.4290 high and 61.8% Fibonacci level towards support at the 1.4200 level. Intraday and daily studies are unwinding ovberbought readings and threatens break here open up room for deeper pullback to correct strong gains from the 1.3730, August swing low. Below 1.4200 will open up room to strong support at the 1.4150/1.4140 congestion and November 2025 high. Meanwhile, resistance remains at the 1.4250/1.4290, June and 5 October highs. Break here, if seen, will see room to the 1.4330 channel resistance and 1.4350 congestion.