Published: 2026-05-22T00:35:17.000Z
Chart NZD/USD Update: Higher in range from .5815 support
2
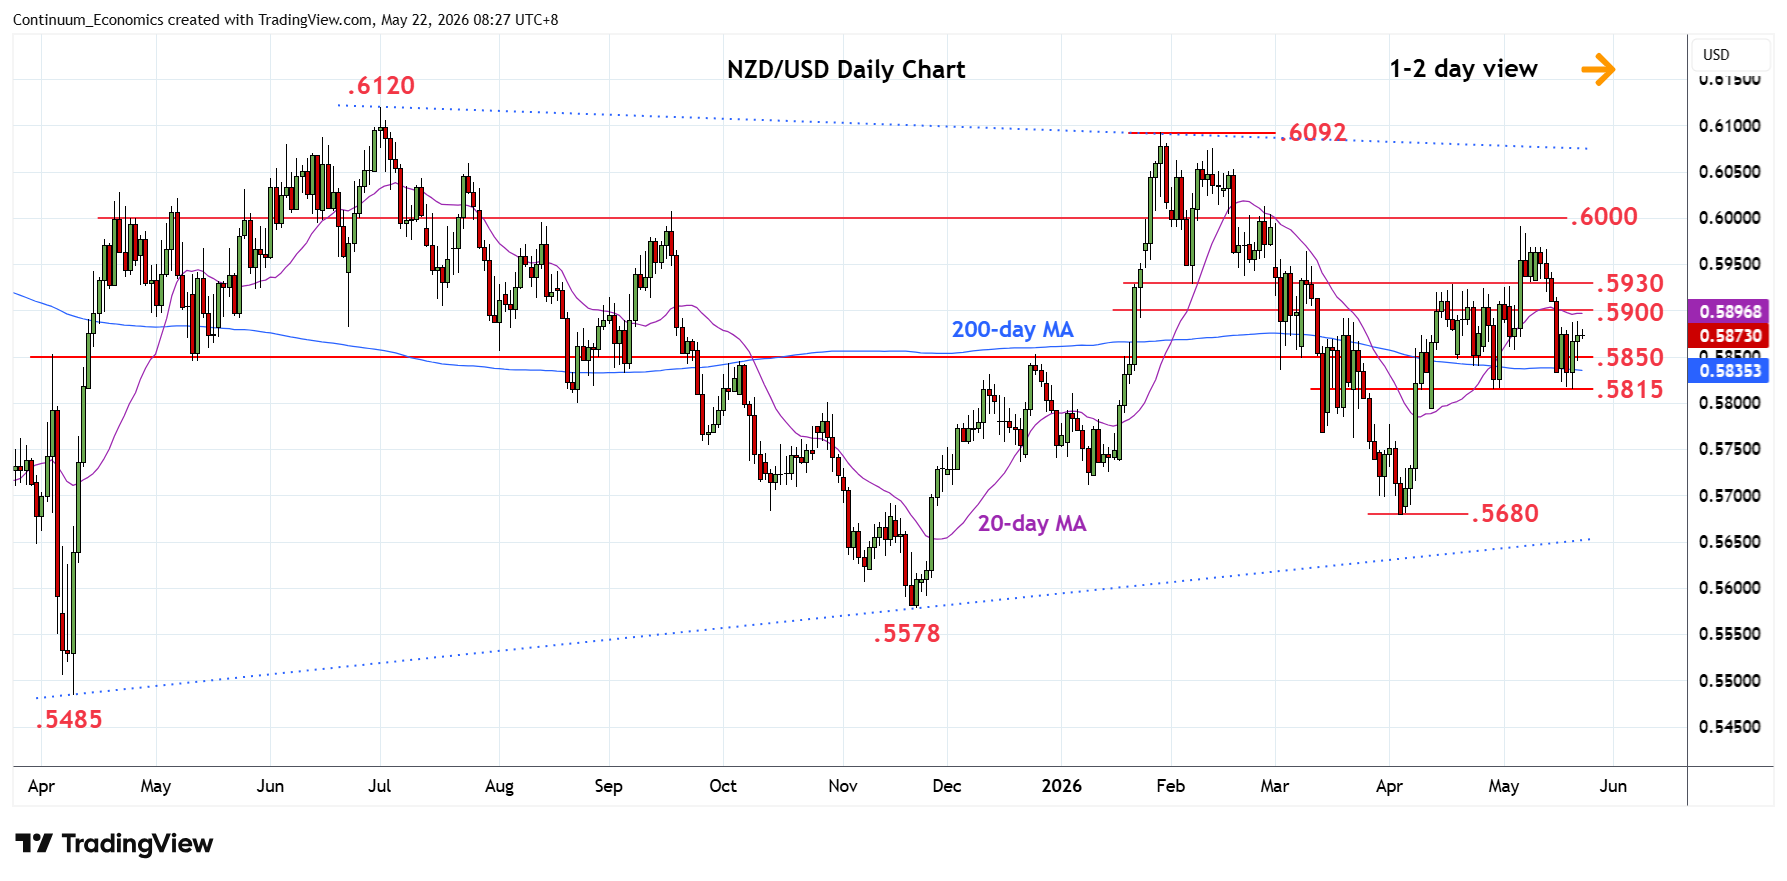
Higher in range to approach the .5900 level following bounce from the .5815 support
| Levels | Imp | Comment | Levels | Imp | Comment | |||
|---|---|---|---|---|---|---|---|---|
| R4 | .6000/13 | * | congestion, 26 Feb high | S1 | .5815 | ** | 29 Apr low | |
| R3 | .5990 | ** | 6 May high | S2 | .5800 | * | congestion | |
| R2 | .5930 | ** | Feb low, congestion | S3 | .5750 | * | congestion | |
| R1 | .5900 | * | congestion | S4 | .5700 | * | congestion |
Asterisk denotes strength of level
00:30 GMT - Higher in range to approach the .5900 level following bounce from the .5815 support. Consolidation here tracing out a flag pattern and threatens break to extend the broader losses from the .5990, 6 May high. Lower will see room for deeper pullback to support at the .5800/.5750 congestion. Meanwhile, resistance remains at the .5900/.5930 area which is expected to cap. Would need to clear this to fade the downside pressure and revive upside focus for retest of the .5990 high and further extend gains from the .5680 April current year low.