Published: 2026-07-09T08:16:16.000Z
Chart USD Index DXY Update: Leaning lower
4
Cautious trade is giving way to a drift lower
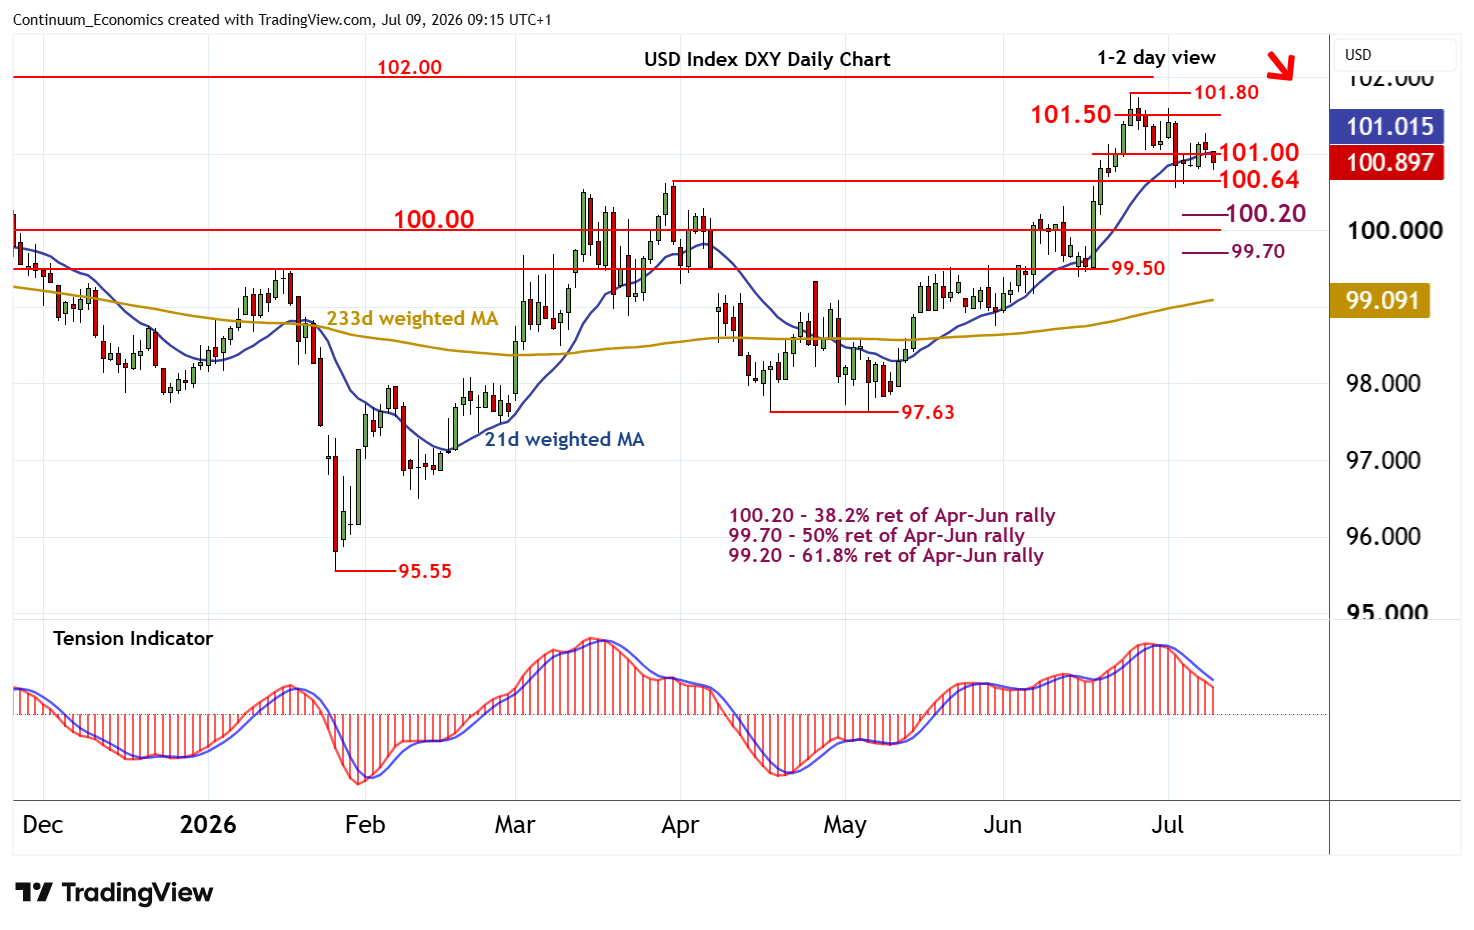
| Levels | Imp | Comment | Levels | Imp | Comment | |||
|---|---|---|---|---|---|---|---|---|
| R4 | 102.00 | ** | congestion | S1 | 100.64 | ** | 31 Mar (m) high | |
| R3 | 101.80 | * | 24 Jun YTD high | S2 | 100.20 | ** | 38.2% ret of Apr-Jun rally | |
| R2 | 101.50 | intraday break level | S3 | 100.00 | ** | congestion | ||
| R1 | 101.00 | ** | congestion base | S4 | 99.70 | ** | 50% ret of Apr-Jun rally |
Asterisk denotes strength of level
09:00 BST - Cautious trade is giving way to a drift lower, as intraday studies turn down, with the break below 101.00 current balanced around 100.90. The daily Tension Indicator is also under pressure, highlighting room for a test of support at the 100.64 monthly low of 31 March. However, flat oversold daily stochastics could limit any initial tests in consolidation, before unwinding overbought weekly stochastics extend late-June losses towards the 100.00 - 100.20 range. Meanwhile, a close back above 101.00 would help to stabilise price action and prompt consolidation beneath resistance at 101.50.