Published: 2026-09-03T00:45:29.000Z
Chart NZD/USD Update: Consolidating sharp losses
1
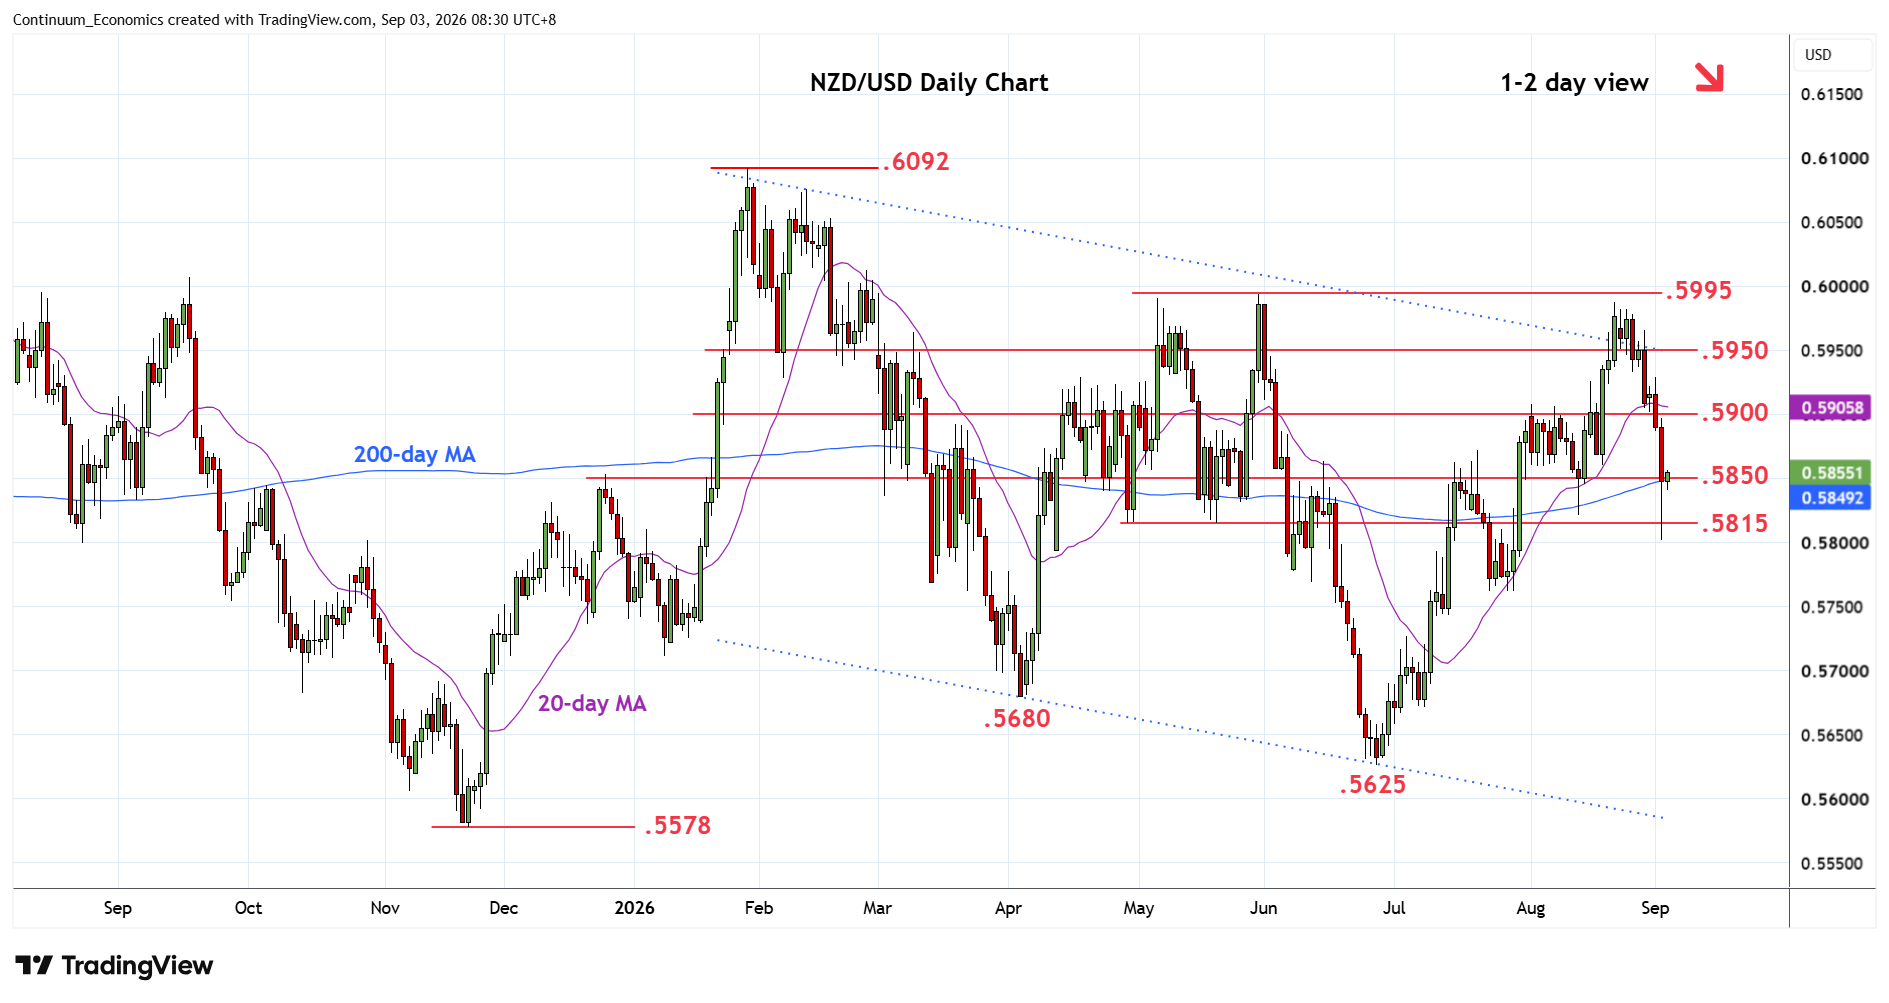
Sharp losses below .5850 reached support at the .5815/00 area before turning higher to consolidate around .5850 congestion
| Levels | Imp | Comment | Levels | Imp | Comment | |||
|---|---|---|---|---|---|---|---|---|
| R4 | .5988 | ** | Aug high | S1 | .5815 | * | May low | |
| R3 | .5950 | * | congestion | S2 | .5805/00 | ** | 50%, congestion | |
| R2 | .5930 | 1 Sep high | S3 | .5765 | * | 61.8% Jun/Aug rally | ||
| R1 | .5900 | * | congestion | S4 | .5750 | * | congestion |
Asterisk denotes strength of level
00:35 GMT - Sharp losses below .5850 reached support at the .5815/00 area before turning higher to consolidate around .5850 congestion as prices unwind oversold intraday studies. However, negative daily and weekly studies keep pressure on the downside and suggest consolidation giving way to renewed selling pressure later to retrace strong gains from the .5625 June current year low. Below .5800 level will see scope to support at .5765/50 area. Meanwhile, resistance is at the .5900/30 area. Regaining this will fade the downside pressure and return focus to the .5988, August high.