Published: 2026-11-13T06:25:53.000Z
Chart USD Index DXY Update: Extending gains
-
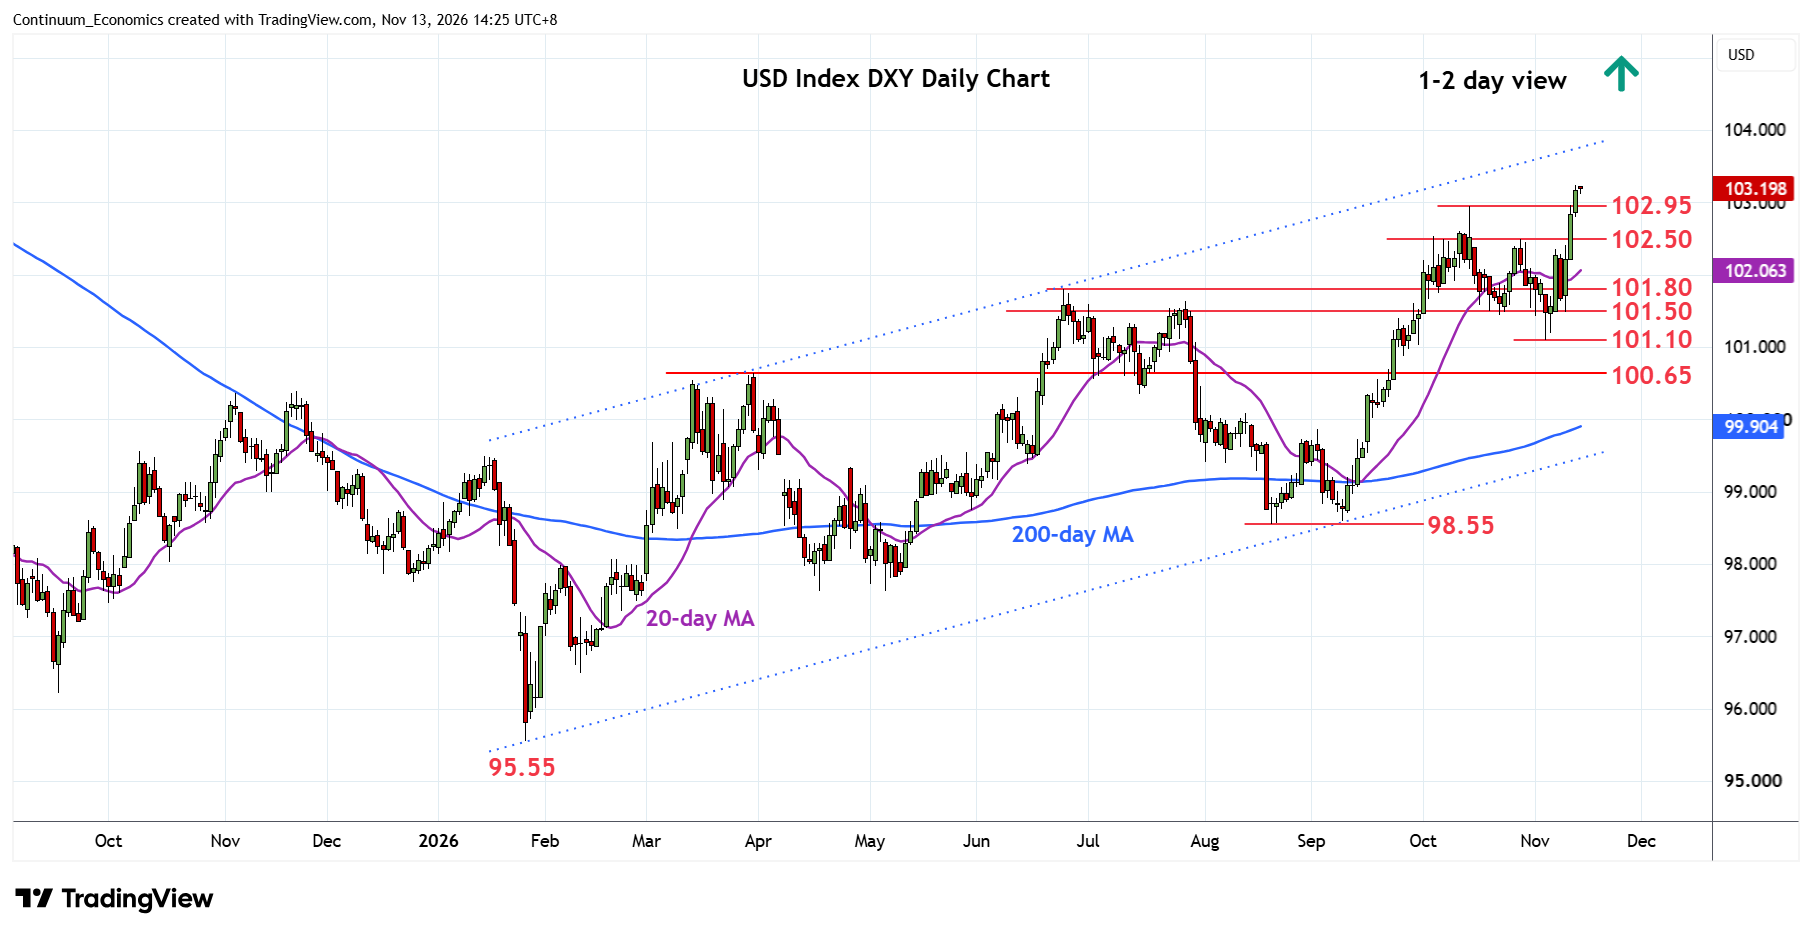
Break above the 102.95 October high has seen gains to reach fresh year high at 103.24
| Levels | Imp | Comment | Levels | Imp | Comment | |||
|---|---|---|---|---|---|---|---|---|
| R4 | 104.60/68 | * | 61.8%, 26 Mar high | S1 | 102.50 | ** | congestion | |
| R3 | 104.00 | ** | congestion | S2 | 102.00 | * | congestion | |
| R2 | 103.50 | * | congestion | S3 | 101.80 | ** | Jun high | |
| R1 | 103.24 | ** | 12 Nov YTD high | S4 | 101.50 | * | congestion |
Asterisk denotes strength of level
06:20 GMT - Break above the 102.95 October high has seen gains to reach fresh year high at 103.24. Consolidation here see prices unwinding overbought intraday studies but pressure remains on the upside and see room for further gains ahead to the strong resistance at the 103.50/104.00 congestion area. Higher still, will see room to 104.60, 61.8% Fibonacci retracement. Meanwhile, support at the 102.50 congestion and late-October high should now underpin. Break here will ease the upside pressure and see room for deeper pullback to support at the 102.00/101.80 congestion and June high.