Chart USD/JPY Update: Consolidating sharp losses
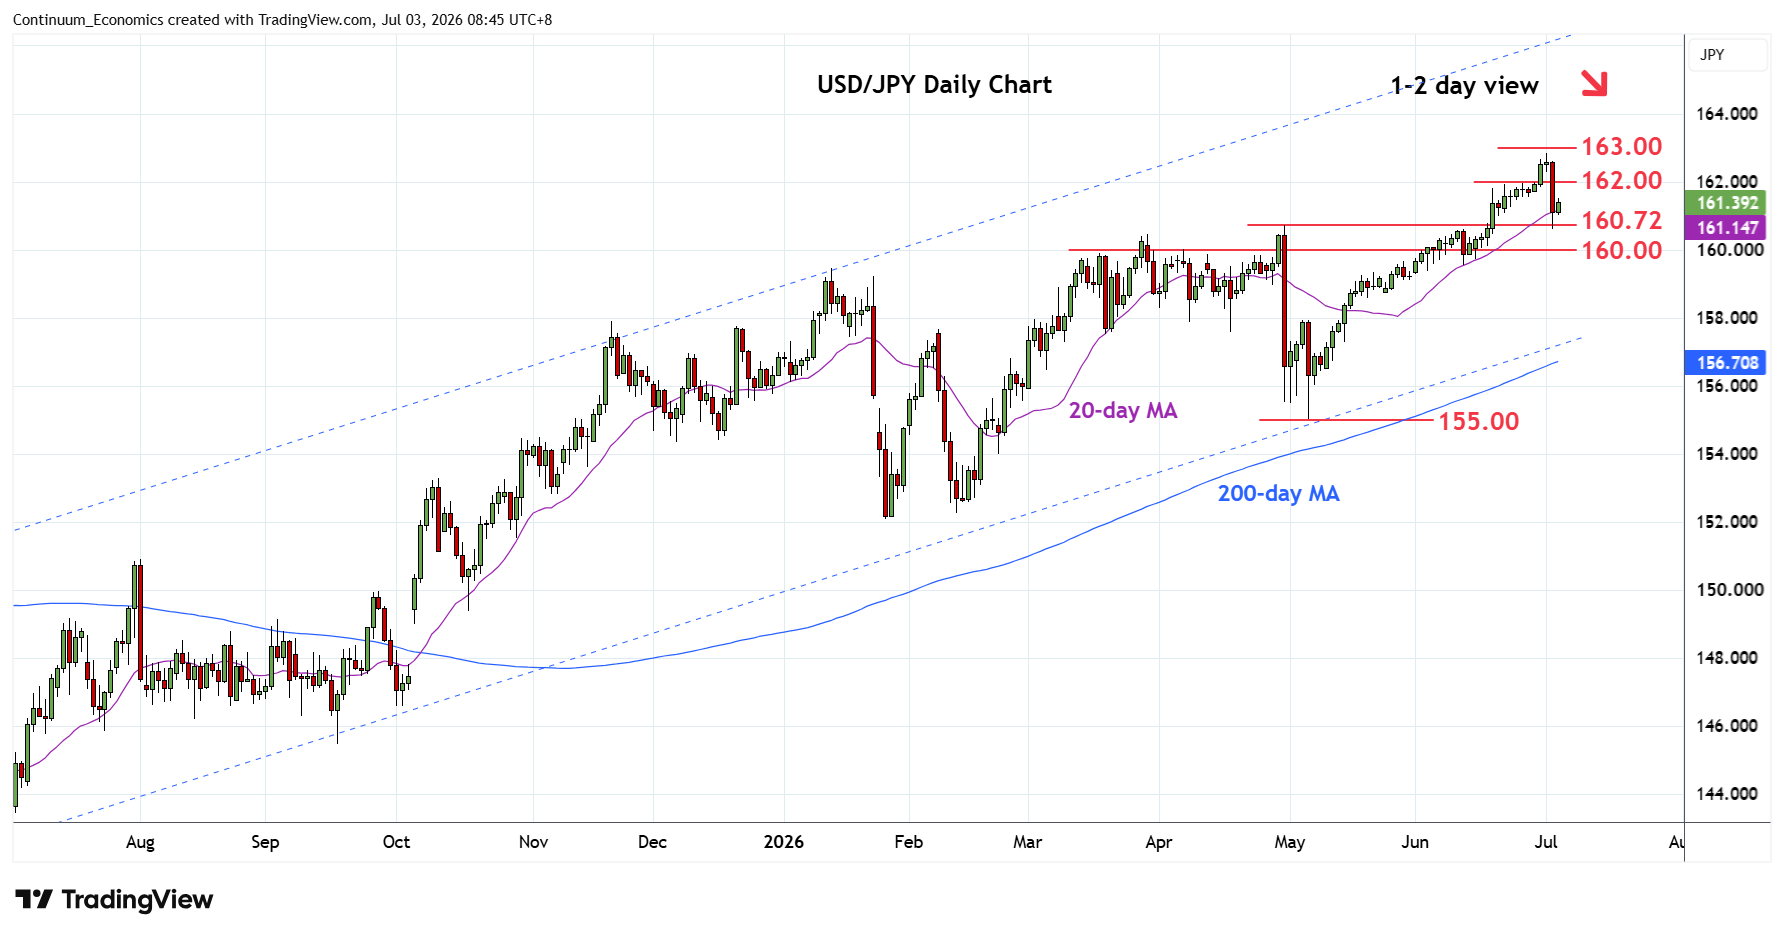
Consolidation below the 162.84 high gave way to sharp losses through the 161.00 level before finding support at 160.72 April high
| Levels | Imp | Comment | Levels | Imp | Comment | |||
|---|---|---|---|---|---|---|---|---|
| R4 | 164.00 | * | Dec 1986 high | S1 | 160.72 | ** | Apr high | |
| R3 | 163.00 | * | congestion from Dec 1986 | S2 | 160.00 | * | figure | |
| R2 | 162.84 | ** | 1 Jul YTD high | S3 | 159.50 | * | congestion | |
| R1 | 162.00 | * | congestion | S4 | 159.00 | * | congestion |
Asterisk denotes strength of level
01:00 GMT - Consolidation below the 162.84 high gave way to sharp losses through the 161.00 level before finding support at 160.72 April high. Bounce here see prices settling into consolidation above the 161.00 level and unwinding oversold intraday studies. However, bearish pullback from the 162.84 high keep pressure on the downside and see scope for extension lower to retrace strong gains from the 155.00 May low. Lower will see room to support at the 160.00/159.50 area. Meanwhile, resistance is at the 162.00 congestion which is expected to cap and keep pressure on the downside.