Chart USD/ZAR Update: Consolidating sharp gains
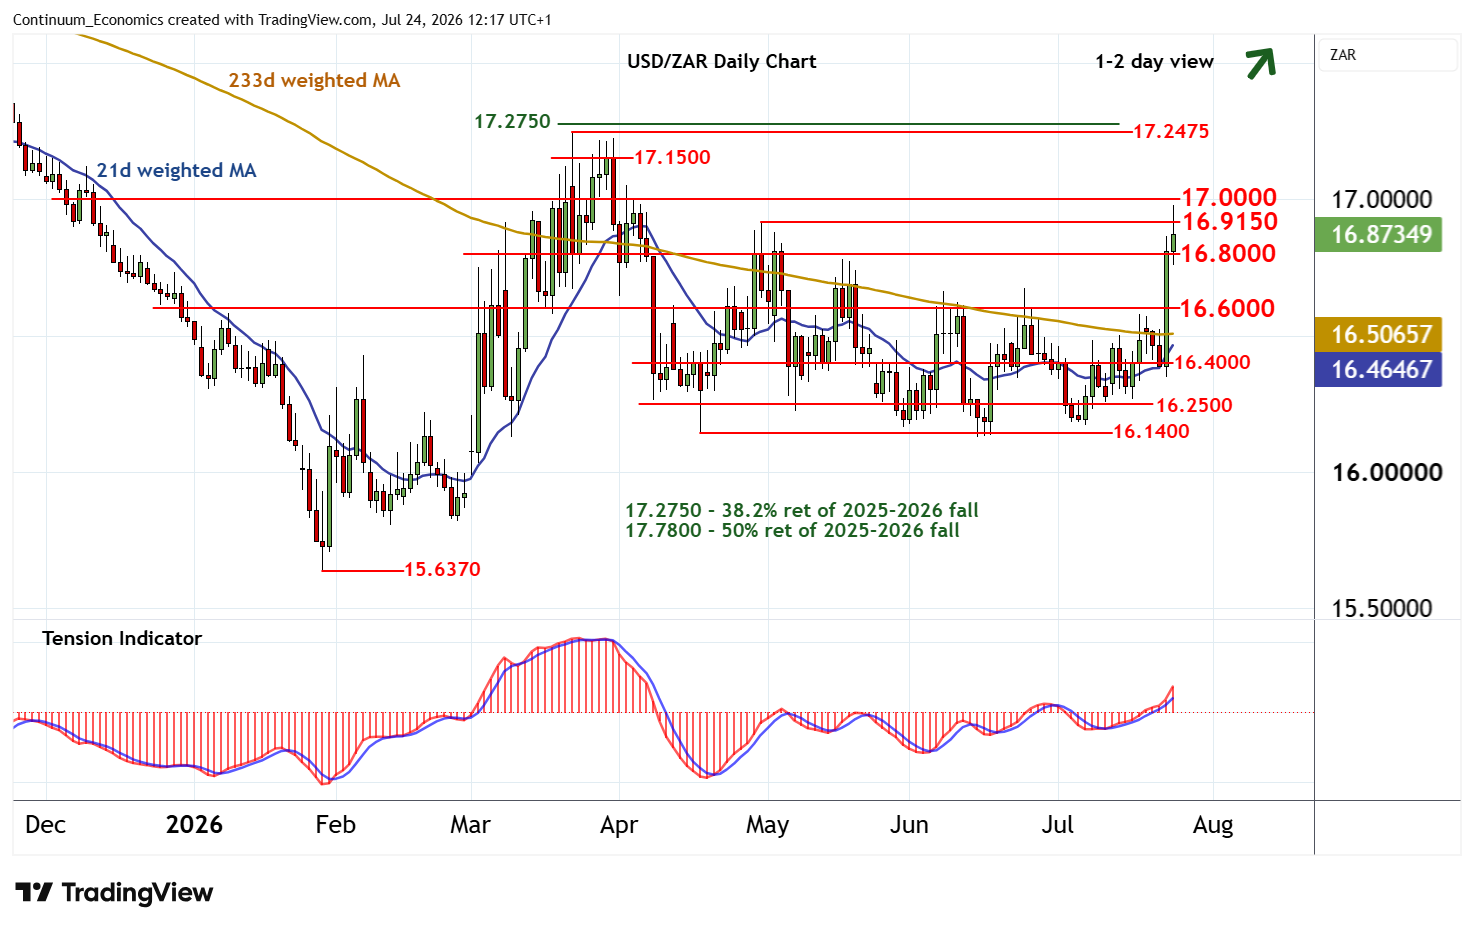
A sharper/earlier than anticipated break higher has tested levels above the 16.9150 weekly high of 30 April
| Level | Comment | Level | Comment | |||||
|---|---|---|---|---|---|---|---|---|
| R4 | 17.2475 | ** | 23 Mar YTD high | S1 | 16.8000 | ** | congestion | |
| R3 | 17.1500 | * | congestion | S2 | 16.6000 | * | congestion | |
| R2 | 17.0000 | * | congestion | S3 | 16.4000 | congestion | ||
| R1 | 16.9150 | ** | 30 Apr (w) high | S4 | 16.2500 | * | congestion |
Asterisk denotes strength of level
11:50 BST - A sharper/earlier than anticipated break higher has tested levels above the 16.9150 weekly high of 30 April, before settling lower in consolidation beneath here as overbought intraday studies unwind. Daily readings are mixed/positive and broader weekly charts are rising, suggesting room for further strength in the coming sessions. A close above 16.9150 will help to improve sentiment and extend mid-April gains towards congestion around 17.0000. However, already overbought daily stochastics should limit any immediate tests above here in profit-taking/consolidation beneath critical resistance at the 17.2475 current year high of 23 March and the 17.2750 Fibonacci retracement. Meanwhile, support is raised to congestion around 16.8000. A close beneath here would turn sentiment neutral and prompt consolidation above congestion support at 16.6000.